Adjastment of UMI collisions on inDrop
Viktor Petukhov
2018-02-11
Source file: notebooks/umi_correction/umi_collisions.Rmd
Last updated: 2018-05-29
Code version: 62ae7c4
library(ggplot2)
library(ggrastr)
library(ggridges)
library(ggsci)
library(dplyr)
library(parallel)
library(reshape2)
library(dropestr)
library(dropEstAnalysis)

theme_set(theme_base)
kPlotsFolder <- '../../output/figures/'
kDataPath <- '../../data/dropest/SCG71/est_01_15_umi_quality/'
SampleNames <- function(prob, size) sample(names(prob), prob=prob, size=size, replace=T)Data loading
holder <- readRDS(paste0(kDataPath, 'SCG71.rds'))umi_distribution <- GetUmisDistribution(holder$reads_per_umi_per_cell)
umi_probs <- umi_distribution / sum(umi_distribution)
max_umi_per_gene <- 4^nchar(names(umi_probs)[1])Distribution of UMIs:
PlotUmisDistribution(holder$reads_per_umi_per_cell, bins=70)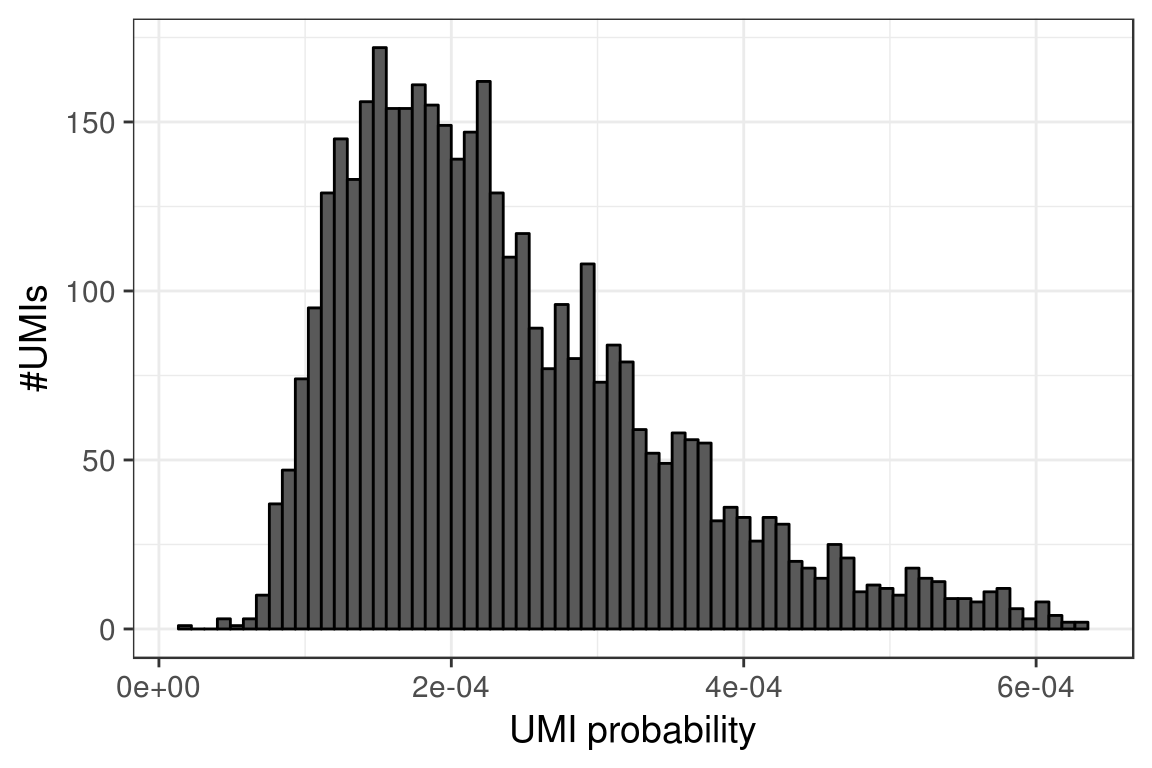
Modeling of collisions
total_umi_nums <- seq(0, 25000, 20)
n_reps <- 10
uniq_umi_samples <- sapply(1:10, function(i)
  sapply(total_umi_nums, function(n) SampleNames(umi_probs, n) %>% unique() %>% length()))

collisions_info <- FillCollisionsAdjustmentInfo(umi_probs, max_umi_per_gene)
umis_df <- tibble(Unique=as.vector(uniq_umi_samples),
Total=rep(total_umi_nums, n_reps))
fig_width <- 3.5
fig_height <- 4
collisions_df <- tibble(Unique=1:max_umi_per_gene, Empirical=collisions_info) %>%
mutate(Uniform=sapply(Unique, AdjustGeneExpressionUniform, umis_number=max_umi_per_gene))
gg_collisions <- ggplot(collisions_df, aes(x=Unique, y=Total - Unique)) +
geom_point_rast(aes(color='Sampling'), data=umis_df, size=1, alpha=0.1,
width=fig_width, height=fig_height) +
geom_vline(aes(xintercept=max_umi_per_gene), linetype='dashed') +
geom_line(aes(y=Empirical - Unique, color='Empirical'), size=1) +
geom_line(aes(y=Uniform - Unique, color='Uniform'), size=1) +
scale_color_hue(l=55) +
scale_y_continuous(expand=c(0, 0), name='#Underestimated UMIs', limits=c(0, 7500)) +
xlab('#Observed UMIs') +
scale_color_manual(values=c(Empirical='#e02323', Uniform='#194aea', Sampling='black'),
name='Estimation type') +
theme_pdf(legend.pos=c(0, 1)) +
guides(color=guide_legend(override.aes=list(size=c(1.0, 1.5, 1.0), shape=c(NA, 16, NA),
linetype=c(1,0,1), alpha=1)))gg_collisions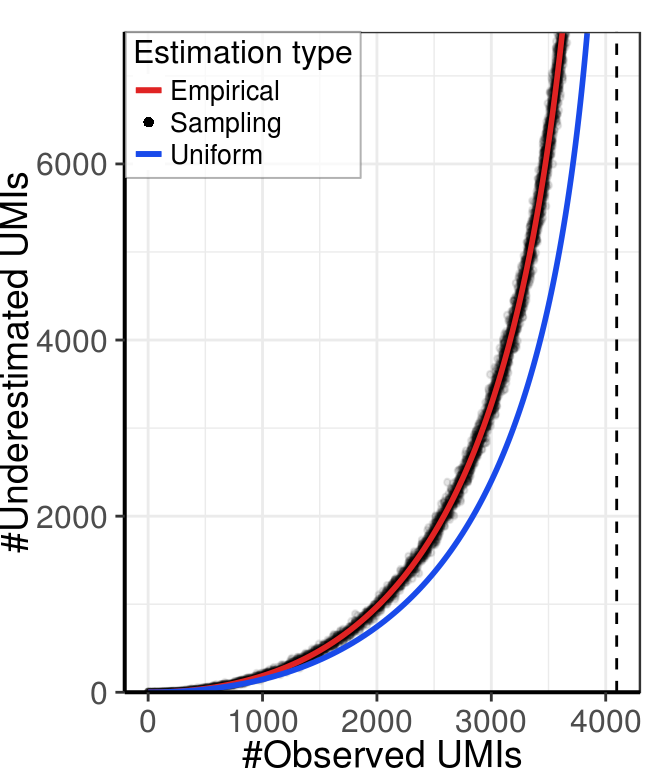
rm(holder, umi_distribution, umi_probs, collisions_info, umis_df, collisions_df)
invisible(gc())
Aberrant mononucleotide stretches
kDataPath <- '../../data/dropest/10x/aml035_post_transplant/est_10_20_umi_quality/'
reads_per_umi <- readRDS(paste0(kDataPath, 'reads_per_umi_per_cell.rds'))
umi_distribution <- GetUmisDistribution(reads_per_umi, smooth=0)
umi_distribution <- umi_distribution[umi_distribution > 0]
tail_threshold <- quantile(umi_distribution, 0.995)
umi_distribution_tail <- umi_distribution[umi_distribution > tail_threshold]rm(reads_per_umi)
invisible(gc())prefix_lengths <- seq(2, 10, 2)
distrs_by_length <- mclapply(prefix_lengths, MaxFreqDistribution, umi_distribution_tail,
mc.cores=5)
plot_df <- lapply(1:length(prefix_lengths), function(i)
cbind(melt(distrs_by_length[[i]], id.vars = 'fracs'), PrefixLength=prefix_lengths[i])) %>%
bind_rows()gl <- guide_legend(title='Distribution')
gg_stretches <- ggplot(plot_df, aes(x = fracs, y = as.factor(PrefixLength), height = value,
fill=variable, linetype=variable)) +
geom_density_ridges(stat = "identity", scale = 0.95, alpha=0.7) +
scale_x_continuous(expand = c(0.005, 0.005), limits=c(0.2, 1.0)) +
scale_y_discrete(expand = c(0.02, 0.02)) +
labs(x='Fraction of the most\nfrequent nucleotide', y='UMI prefix length') +
theme_pdf(legend.pos=c(0.01, 0)) +
guides(fill=gl, linetype=gl) +
scale_fill_npg()
gg_stretches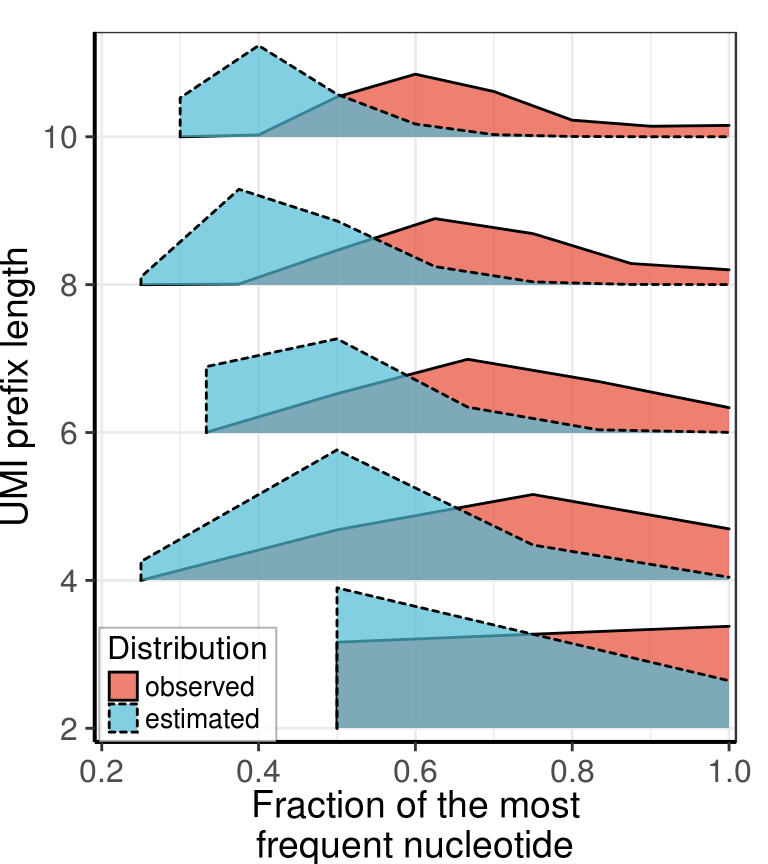
Complete figure
gg_fig <- cowplot::plot_grid(gg_stretches, gg_collisions,
                             labels="AUTO", align="h")
gg_fig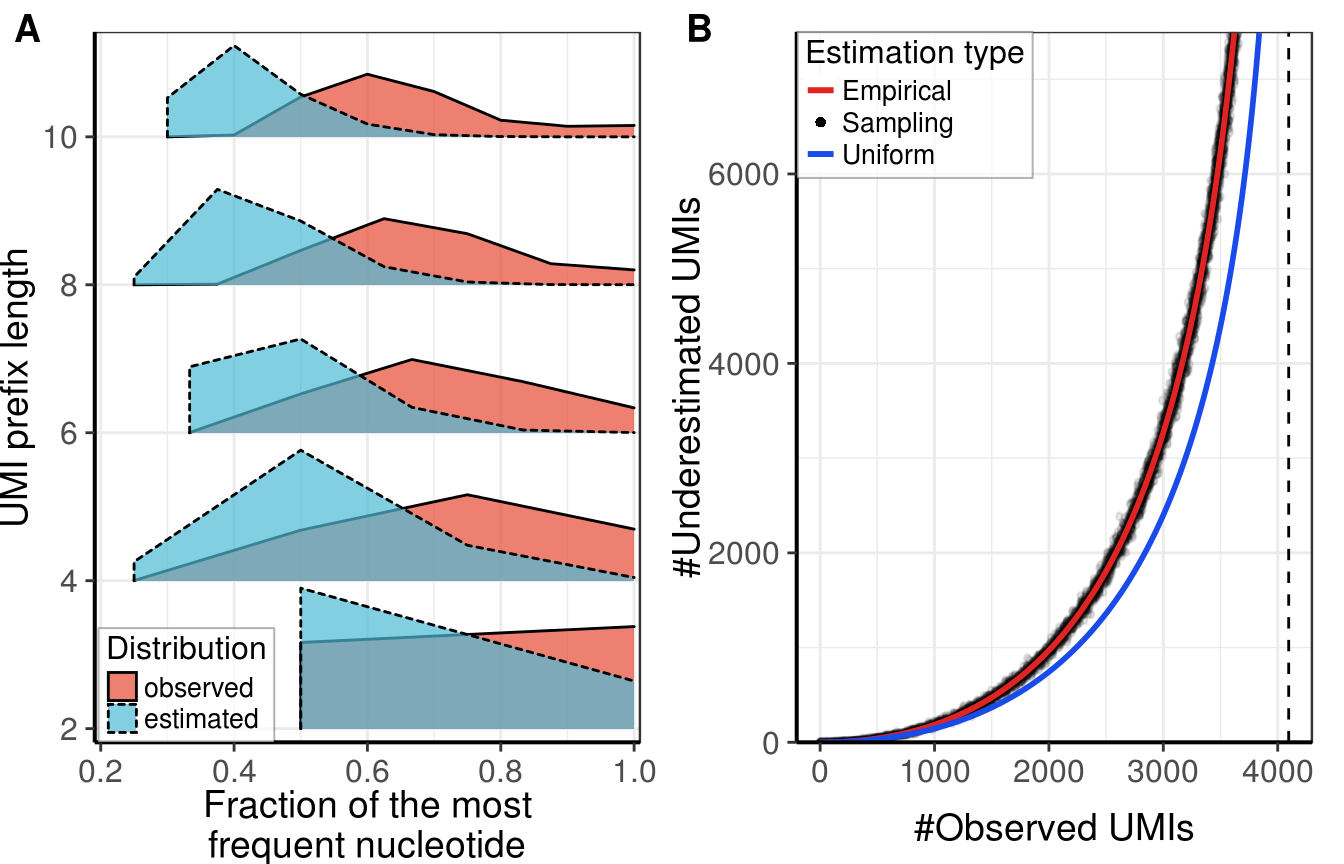
ggsave(paste0(kPlotsFolder, 'supp_umi_collision_modeling.pdf'), gg_fig,
       width=8, height=4)
Session information
| value | |
|---|---|
| version | R version 3.4.1 (2017-06-30) |
| os | Ubuntu 14.04.5 LTS |
| system | x86_64, linux-gnu |
| ui | X11 |
| language | (EN) |
| collate | en_US.UTF-8 |
| tz | America/New_York |
| date | 2018-05-29 |
| package | loadedversion | date | source | |
|---|---|---|---|---|
| 1 | assertthat | 0.2.0 | 2017-04-11 | CRAN (R 3.4.1) |
| 2 | backports | 1.1.2 | 2017-12-13 | CRAN (R 3.4.1) |
| 4 | bindr | 0.1 | 2016-11-13 | CRAN (R 3.4.1) |
| 5 | bindrcpp | 0.2 | 2017-06-17 | CRAN (R 3.4.1) |
| 6 | Cairo | 1.5-9 | 2015-09-26 | CRAN (R 3.4.1) |
| 7 | clisymbols | 1.2.0 | 2017-05-21 | CRAN (R 3.4.1) |
| 8 | colorspace | 1.3-2 | 2016-12-14 | CRAN (R 3.4.1) |
| 10 | cowplot | 0.9.2 | 2017-12-17 | CRAN (R 3.4.1) |
| 12 | digest | 0.6.15 | 2018-01-28 | cran (@0.6.15) |
| 13 | dplyr | 0.7.4 | 2017-09-28 | CRAN (R 3.4.1) |
| 14 | dropEstAnalysis | 0.6.0 | 2018-05-16 | local (VPetukhov/dropEstAnalysis@NA) |
| 15 | dropestr | 0.7.7 | 2018-03-17 | local (@0.7.7) |
| 16 | evaluate | 0.10.1 | 2017-06-24 | CRAN (R 3.4.1) |
| 17 | ggplot2 | 2.2.1 | 2016-12-30 | CRAN (R 3.4.1) |
| 18 | ggrastr | 0.1.5 | 2017-12-28 | Github (VPetukhov/ggrastr@cc56b45) |
| 19 | ggridges | 0.4.1 | 2017-09-15 | CRAN (R 3.4.1) |
| 20 | ggsci | 2.8 | 2017-09-30 | CRAN (R 3.4.1) |
| 21 | git2r | 0.21.0 | 2018-01-04 | cran (@0.21.0) |
| 22 | glue | 1.2.0 | 2017-10-29 | CRAN (R 3.4.1) |
| 26 | gtable | 0.2.0 | 2016-02-26 | CRAN (R 3.4.1) |
| 27 | highr | 0.6 | 2016-05-09 | CRAN (R 3.4.1) |
| 28 | htmltools | 0.3.6 | 2017-04-28 | CRAN (R 3.4.1) |
| 29 | knitr | 1.20 | 2018-02-20 | cran (@1.20) |
| 30 | labeling | 0.3 | 2014-08-23 | CRAN (R 3.4.1) |
| 31 | lazyeval | 0.2.1 | 2017-10-29 | CRAN (R 3.4.1) |
| 32 | magrittr | 1.5 | 2014-11-22 | CRAN (R 3.4.1) |
| 34 | munsell | 0.4.3 | 2016-02-13 | CRAN (R 3.4.1) |
| 36 | pkgconfig | 2.0.1 | 2017-03-21 | CRAN (R 3.4.1) |
| 37 | plyr | 1.8.4 | 2016-06-08 | CRAN (R 3.4.1) |
| 38 | R6 | 2.2.2 | 2017-06-17 | CRAN (R 3.4.1) |
| 39 | Rcpp | 0.12.17 | 2018-05-18 | cran (@0.12.17) |
| 40 | reshape2 | 1.4.3 | 2017-12-11 | CRAN (R 3.4.1) |
| 41 | rlang | 0.1.4 | 2017-11-05 | CRAN (R 3.4.1) |
| 42 | rmarkdown | 1.9 | 2018-03-01 | CRAN (R 3.4.1) |
| 43 | rprojroot | 1.3-2 | 2018-01-03 | cran (@1.3-2) |
| 44 | scales | 0.5.0 | 2017-08-24 | CRAN (R 3.4.1) |
| 45 | sessioninfo | 1.0.0 | 2017-06-21 | CRAN (R 3.4.1) |
| 47 | stringi | 1.1.7 | 2018-03-12 | cran (@1.1.7) |
| 48 | stringr | 1.3.0 | 2018-02-19 | cran (@1.3.0) |
| 49 | tibble | 1.3.4 | 2017-08-22 | CRAN (R 3.4.1) |
| 52 | withr | 2.1.2 | 2018-03-15 | cran (@2.1.2) |
| 53 | yaml | 2.1.18 | 2018-03-08 | cran (@2.1.18) |
This R Markdown site was created with workflowr