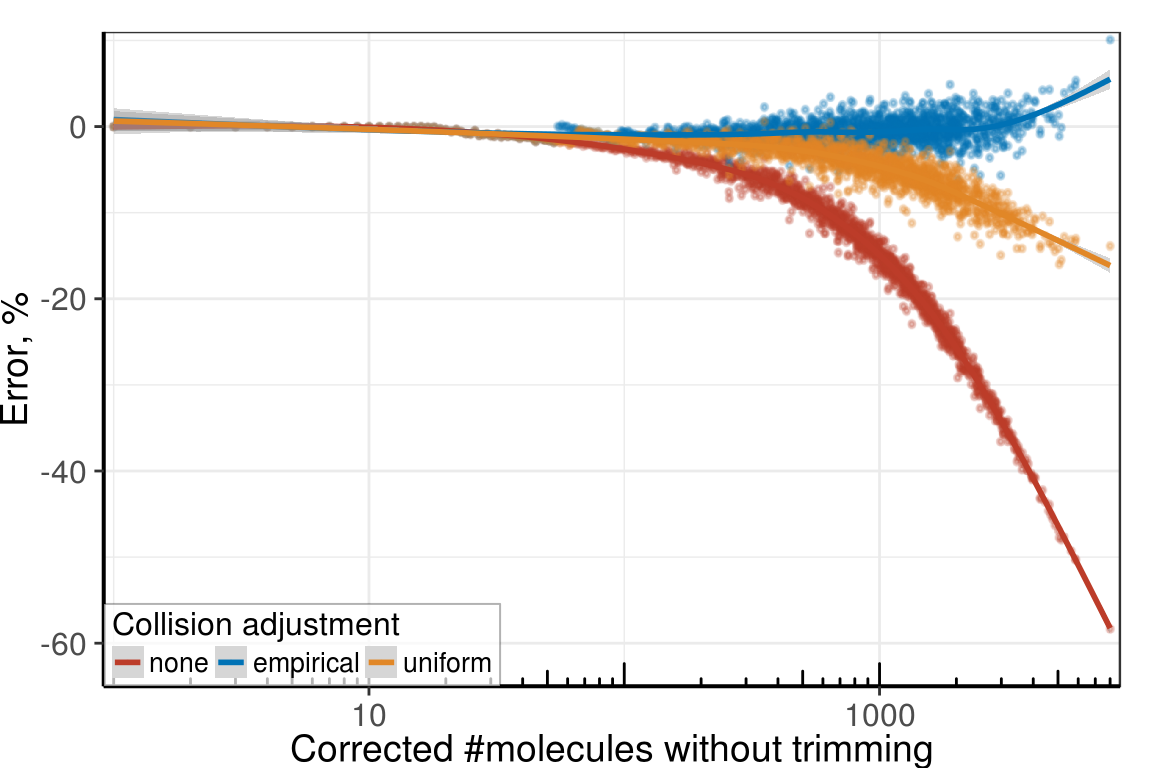
Supp. Figure Collisions
umis_per_gene_df <- as.data.frame(lapply(trimmed[1:4], `[[`, 'umis.per.gene'))
umis_per_gene_df$raw <- raw$umis_per_gene
colnames(umis_per_gene_df)[1:4] <- paste0(kTrimmedLengths)

umis_per_gene_adj_df <- trimmed[1:4] %>%
  lapply(function(tr) tr$collisions.info[tr$umis.per.gene]) %>% as.data.frame()
colnames(umis_per_gene_adj_df) <- paste0(kTrimmedLengths)

umis_per_gene_adj_classic_df <- mclapply(kTrimmedLengths, function(i) sapply(
  trimmed[[i - 5]]$umis.per.gene, AdjustGeneExpressionUniform, 4^i), mc.cores=5) %>%
  as.data.frame()
colnames(umis_per_gene_adj_classic_df) <- paste0(kTrimmedLengths)

plot_df <- melt(umis_per_gene_df, id.vars='raw', variable.name='UmiLen',
                value.name='NoAdjustment')
plot_df$Adjusted <- melt(umis_per_gene_adj_df)$value
plot_df$AdjustedClassic <- melt(umis_per_gene_adj_classic_df)$value

plot_df <- melt(plot_df, id.vars=c('raw', 'UmiLen'), variable.name='Adjustment') %>%
  filter(raw > 5)
plot_dfs <- split(plot_df, plot_df$UmiLen)
scale_y_low <- scale_y_continuous(limits=c(-3000, 0), breaks=seq(0, -2500, by=-2500), expand=c(0, 0))

ggs <- lapply(names(plot_dfs), function(n)
  ggplot(plot_dfs[[n]], aes(x=raw, y=(value - raw), linetype=Adjustment, col=UmiLen)) +
    geom_smooth() +
    scale_color_manual(values=scales::hue_pal()(4)[as.integer(n) - 5]) +
    scale_linetype_manual(labels=c('No adjustment', 'Empirical', 'Uniform'),
                          values=c('solid', 'dashed', 'dotted')) +
    scale_x_continuous(expand=c(0, 0), limits=c(0, 12300),
                       breaks=seq(0, 10000, 2500)) +
    scale_y_continuous(expand=c(0, 0), limits=c(-10000, 0)) +
    theme_pdf())

ggs[3:4] <- lapply(ggs[3:4], `+`, scale_y_low)
ggs[[1]] <- ggs[[1]] + theme_pdf(legend.pos=c(0, 0)) + theme(legend.box='horizontal') +
  scale_color_manual(values=alpha(scales::hue_pal()(4), 0.7), name='Length of\ntrimmed UMI',
                     labels=names(plot_dfs), drop=F) +
  guides(color=guide_legend(ncol=2, nrow=2, byrow=T))

ggs <- BuildPanel4(ggs, "", "", return.raw=T, legend.plot.id=1)

ga1 <- plot_grid(plotlist=ggs[c(1,3)], nrow=2, rel_heights=c(2.5, 1), align='v')
ga2 <- plot_grid(plotlist=ggs[c(2,4)], nrow=2, rel_heights=c(2.5, 1), align='v')

supp_fig_collisions <- annotate_figure(ggarrange(ga1, ga2, ncol=2),
                                 bottom=text_grob("#Molecules after trimming", size=14),
                                 left = text_grob("Error after trimming (#molecules)",
                                                  rot=90, size=14))

ggsave(paste0(kPlotsFolder, 'supp_umi_trim_collisions.pdf'), supp_fig_collisions,
       height=4, width=8)
supp_fig_collisions

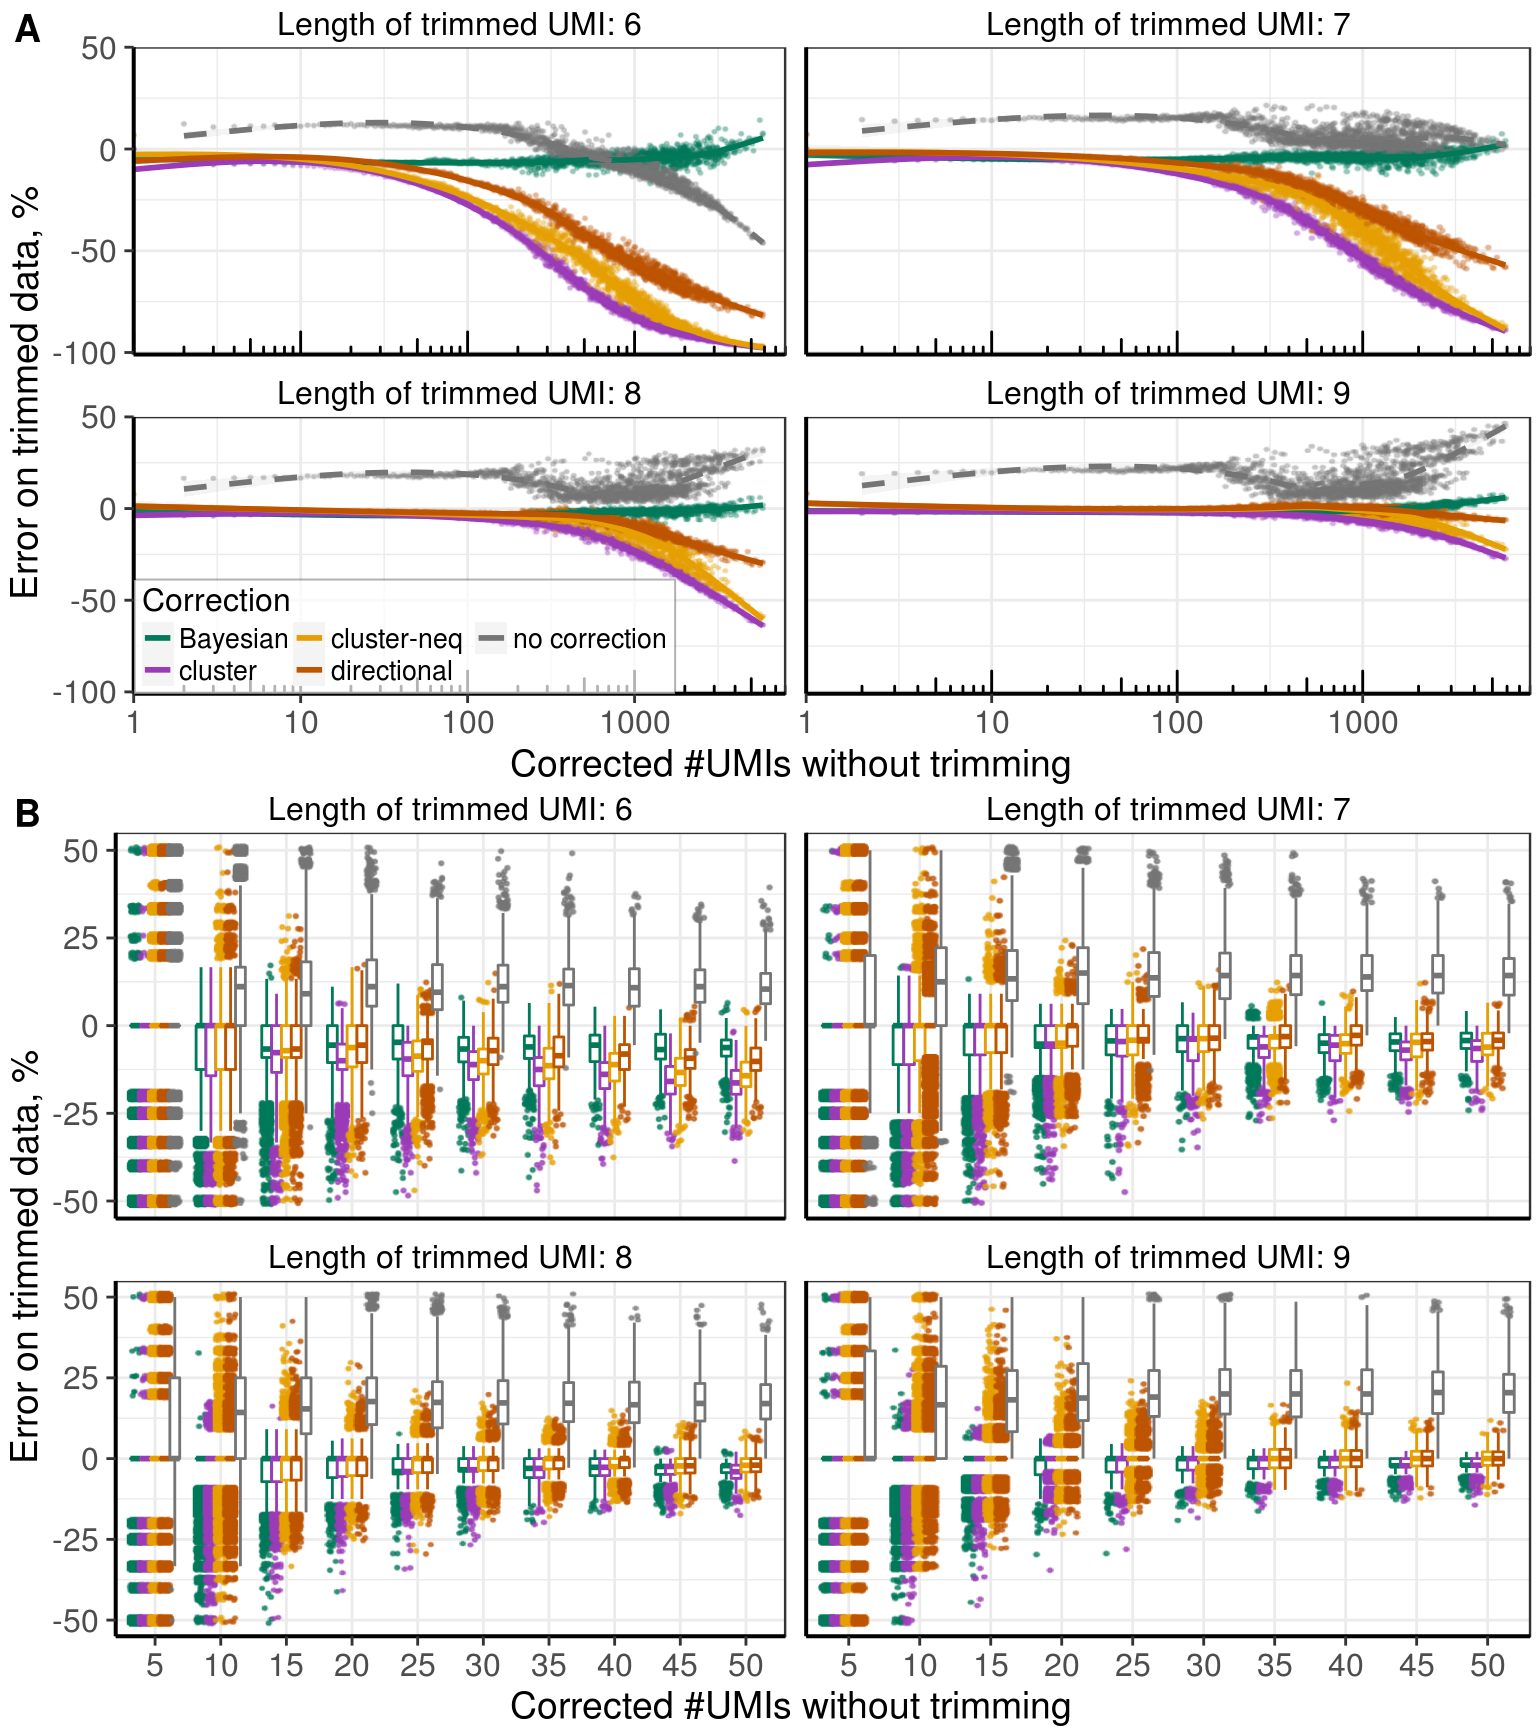
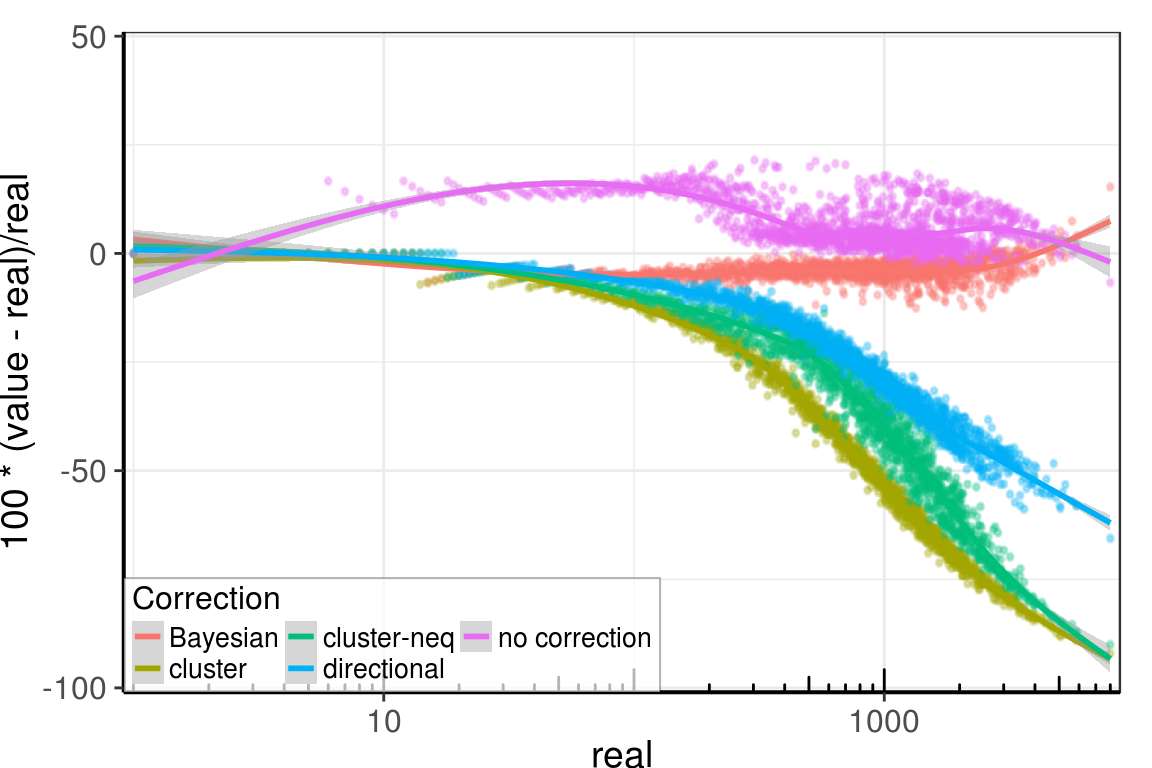
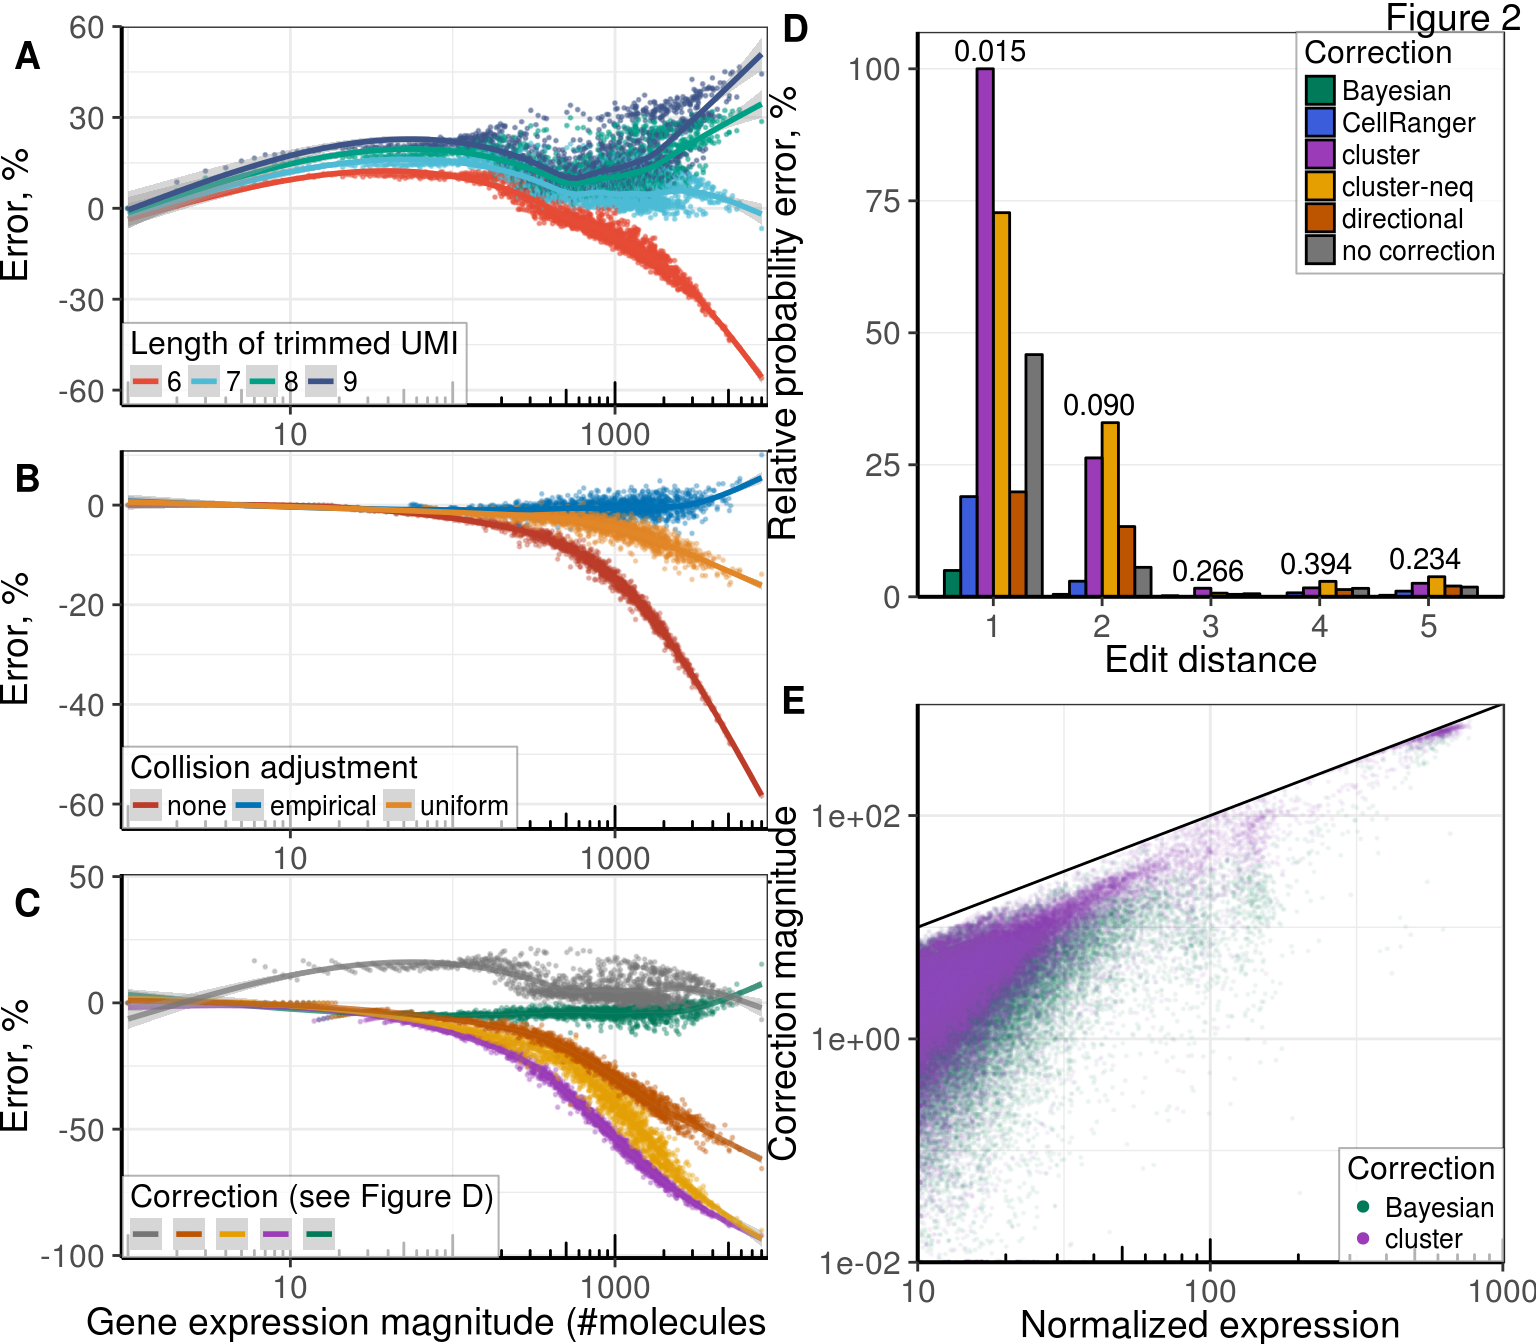
Main figure
umis_per_gene <- as.data.frame(lapply(trimmed, `[[`, 'umis.per.gene'))
colnames(umis_per_gene) <- paste0(kTrimmedLengths)
errors <- ((umis_per_gene - raw$filt_umis_per_gene_simple) / raw$filt_umis_per_gene_simple) %>%
  cbind(Real=raw$filt_umis_per_gene_simple) %>%
  melt(id.vars='Real', variable.name='UmiLength', value.name='Error')

errors_sum <- errors %>% group_by(Real, UmiLength) %>% summarise(Error=mean(Error, trim=0.2))