Filtration of low-qality cells for 10x Frozen BMMCs dataset
Viktor Petukhov
2018-01-23
Source file: notebooks/low_quality_cells/validation_bmmc1.Rmd
Last updated: 2018-05-29
Code version: 33e615d
library(ggplot2)
library(ggrastr)
library(ggpubr)
library(dplyr)
library(parallel)
library(Seurat)
library(dropestr)
library(dropEstAnalysis)

theme_set(theme_base)

set.seed(42)
kOutputFolder <- '../../output/'
kDataPath <- '../../data/'
kEstDataPath <- paste0(kDataPath, 'dropest/10x/frozen_bmmc_healthy_donor1/')
kAnnotationDataPath <- paste0(kDataPath, 'annotation/')
kEstFolder <- paste0(kEstDataPath, 'est_11_10_umi_quality/')
k10xFolder <- paste0(kEstDataPath, 'filtered_matrices_mex/hg19/')
Read data
holder <- readRDS(paste0(kEstFolder, 'bmmc_no_umi.rds'))cm_10x <- Read10xMatrix(k10xFolder)
cm_10x <- cm_10x[, order(Matrix::colSums(cm_10x), decreasing=F)]umis_per_cell <- sort(Matrix::colSums(holder$cm_raw), decreasing=T)
est_cell_num <- EstimateCellsNumber(umis_per_cell)
drop_est_cbs <- names(umis_per_cell)[1:est_cell_num$expected]Here we compare threshold selection, so we can set quality score threshold to 0.5.
intersect_cbs <- intersect(colnames(cm_10x), drop_est_cbs)
rescued_cbs <- setdiff(drop_est_cbs, colnames(cm_10x))

c(Unchanged=length(intersect_cbs), Rescued=length(rescued_cbs))
Unchanged Rescued
1985 1105 r_cm_rescued <- holder$cm_raw[, c(drop_est_cbs, colnames(cm_10x)) %>% unique()]
r_cm_rescued <- r_cm_rescued[grep("^[^;]+$", rownames(r_cm_rescued)),]
if (!all(colnames(cm_10x) %in% colnames(r_cm_rescued)))
stop("All 10x cells must be presented")Rescued cells
r_rescued <- GetPagoda(r_cm_rescued, n.cores=30)3090 cells, 8112 genes; normalizing ... using plain model winsorizing ... log scale ... done.
calculating variance fit ... using gam 146 overdispersed genes ... 146 persisting ... done.
running PCA using 1000 OD genes .... done
calculating distance ... pearson ...running tSNE using 30 cores:# You need to run "annotation/annotation_bmmc1.Rmd" first
clusters_annotated <- paste0(kAnnotationDataPath, 'bmmc1_clusters_annotated.csv') %>%
read.csv() %>% (function(x) setNames(as.character(x$Type), x$Barcode))
notannotated_cells <- setdiff(colnames(r_cm_rescued), names(clusters_annotated))
clusters_annotated_resc <- AnnotateClustersByGraph(r_rescued$graphs$PCA,
clusters_annotated,
notannotated_cells, mc.cores=10)
rescued_clusters <- clusters_annotated_resc[rescued_cbs]
intersect_clusters <- clusters_annotated[intersect_cbs]unchanged_clusters <- names(clusters_annotated) %>% setdiff(rescued_cbs)
long_type_names <- c("CD14+ Monocytes", "Non-dividing Pro B cells", "Monocyte progenitors",
"Epithelial cells", "Cytotoxic T cells", "Immature B cells",
"Dendritic cells", "Pre-pro B cells")
plot_clusters <- clusters_annotated[unchanged_clusters]
plot_rescued_clusters <- rescued_clusters
for (type in long_type_names) {
plot_clusters[plot_clusters == type] <- sub(" ", "\n", type)
plot_rescued_clusters[plot_rescued_clusters == type] <- sub(" ", "\n", type)
}
gg_tsne <- PlotFiltrationResults(r_rescued, plot_clusters, filtered.cbs=NULL,
rescued.clusters=plot_rescued_clusters,
raster.width=4.28, raster.height=4.16,
rescued.alpha=0.5, rescued.size=1.5, lineheight=0.8) +
theme_pdf(legend.pos=c(0, 1), show.ticks=F)
gg_tsne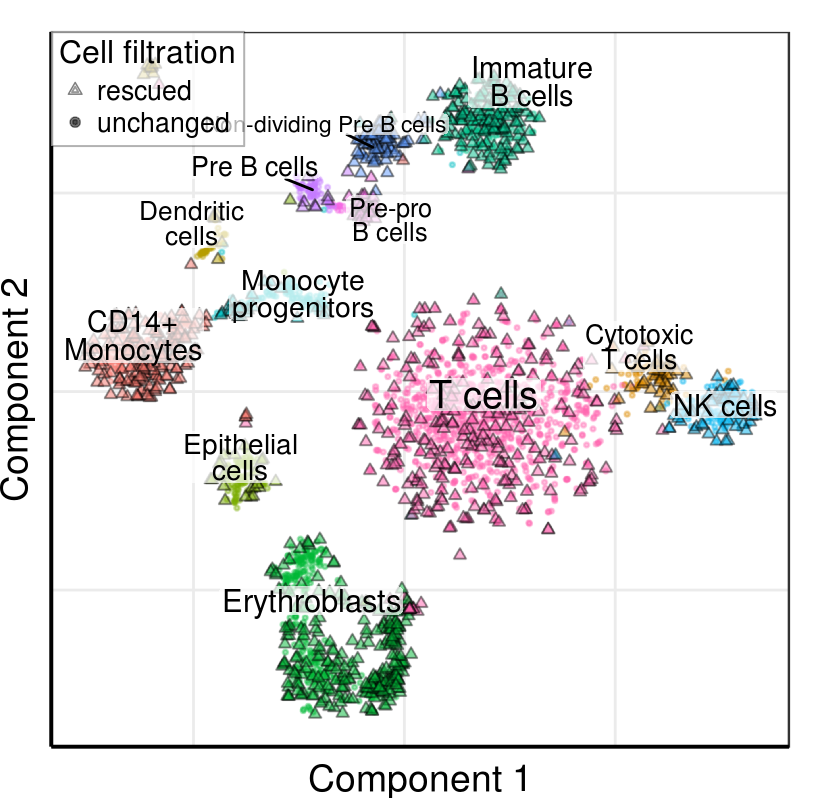
Number of rescued cells per cluster
rescued_table <- TableOfRescuedCells(clusters_annotated_resc[c(intersect_cbs, rescued_cbs)],
                                     rescued_cbs)
write.csv(rescued_table, paste0(kOutputFolder, "tables/rescued_cbc_bmmc1.csv"), row.names=F)
rescued_table| Cell type | Total num. of cells | Num. of rescued | Fraction of rescued, % |
|---|---|---|---|
| CD14+ Monocytes | 305 | 164 | 53.77 |
| Cytotoxic T cells | 105 | 37 | 35.24 |
| Dendritic cells | 90 | 16 | 17.78 |
| Epithelial cells | 136 | 23 | 16.91 |
| Erythroblasts | 509 | 263 | 51.67 |
| Immature B cells | 277 | 133 | 48.01 |
| Monocyte progenitors | 157 | 33 | 21.02 |
| NK cells | 179 | 47 | 26.26 |
| Non-dividing Pre B cells | 93 | 82 | 88.17 |
| Pre B cells | 76 | 8 | 10.53 |
| Pre-pro B cells | 65 | 30 | 46.15 |
| T cells | 1098 | 269 | 24.50 |
Comparison of unchanged and rescued cells
Seurat
Parameters are the same as in the demonstration.
presented_cbs <- intersect(colnames(r_cm_rescued), names(clusters_annotated))
seurat_cm <- r_cm_rescued[, presented_cbs]
seurat_cm <- seurat_cm[Matrix::rowSums(seurat_cm) > 200, ]

srt <- CreateSeuratObject(raw.data = seurat_cm, project = "bmmc1", display.progress=F)
srt <- NormalizeData(object = srt, normalization.method = "LogNormalize",
                     scale.factor = 10000, display.progress=F)
srt <- FindVariableGenes(object = srt, mean.function = ExpMean,
                         dispersion.function = LogVMR, x.low.cutoff = 0.0125,
                         x.high.cutoff = 3, y.cutoff = 1, do.plot=F, display.progress=F)
srt <- ScaleData(object = srt, vars.to.regress = "nUMI", display.progress=F)
Find genes to compare cell types:
srt@ident <- as.factor(clusters_annotated[colnames(srt@raw.data)])
names(srt@ident) <- colnames(srt@raw.data)
compared_clusters <- unique(srt@ident) %>% as.character()
cluster_markers <- mclapply(compared_clusters, function(i)
  mclapply(setdiff(compared_clusters, i), FindClusterMarkers, i, srt, mc.cores=4),
  mc.cores=11)

de_genes <- GetOverexpressedGenes(srt, compared_clusters, cluster_markers)
321 differentially expressed genes found.
Plots
10x CellRanger used wrong threshold:
scores <- ScorePipelineCells(holder, mit.chromosome.name='MT',
                             predict.all=T)[names(umis_per_cell)]

smoothScatter(scores[1:6000], bandwidth=c(60, 0.015), xlab='Cell rank',
              ylab='Quality score')
abline(v=ncol(cm_10x), col='#bc2727', lty=2, lw=2.5)
abline(v=est_cell_num$expected, col='#0a6607', lty=2, lw=2.5)
arrows(x0=c(1000, 4000), y0=c(0.6, 0.7),
       x1=c(ncol(cm_10x) - 100, est_cell_num$expected + 100), y1=c(0.42, 0.52),
       lw=2)
text(x=c(900, 4100), y=c(0.67, 0.75),
     labels=c("10x threshold", "dropEst threshold"), cex=1.3)
tested_clusts <- clusters_annotated[presented_cbs]

separation <- c(setNames(rep('rescued', length(rescued_cbs)), rescued_cbs),
                setNames(rep('real', length(intersect_cbs)), intersect_cbs))

umis_per_cb_subset <- log10(Matrix::colSums(r_cm_rescued[, names(tested_clusts)]))
tested_clusts <- tested_clusts[order(tested_clusts, -umis_per_cb_subset)]
Prepare heatmaps:
plot_df <- ExpressionMatrixToDataFrame(r_rescued$counts[names(tested_clusts), de_genes],
                                       umis_per_cb_subset, tested_clusts,
                                       filtration.type=separation)

plot_df$Cluster <- as.character(plot_df$Cluster)
plot_df$Cluster[plot_df$Cluster == "Non-dividing Pro B cells"] <- "Non-dividing\nPro B cells"

plot_df <- plot_df %>% filter(UmisPerCb < 3.4)
plot_dfs <- split(plot_df, plot_df$FiltrationType)

ggs <- lapply(plot_dfs, HeatmapAnnotGG, umi.per.cell.limits=range(plot_df$UmisPerCb),
              raster.width=3, raster.height=3, raster.dpi=100)

legend_guides <- list(HeatmapLegendGuide('Expression'),
                      HeatmapLegendGuide('Cell type', guide=guide_legend, ncol=3),
                      HeatmapLegendGuide('log10(#molecules)'))
gg_legends <- mapply(`+`, ggs$real, legend_guides, SIMPLIFY=F) %>%
  lapply(`+`, theme(legend.margin=margin(l=4, r=4, unit='pt'))) %>% lapply(get_legend)

ggs$real$heatmap <- ggs$real$heatmap + rremove('xlab') + ylab('Cells')
ggs$rescued$heatmap <- ggs$rescued$heatmap + labs(x = 'Genes', y = 'Cells')
ggs_annot <- lapply(ggs, function(gg) cowplot::plot_grid(
  plotlist=lapply(gg, `+`, theme(legend.position="none", plot.margin=margin())),
  nrow=1, rel_widths=c(1.5, 0.1, 0.1), align='h'))

gg_legends_plot <- cowplot::plot_grid(plotlist=gg_legends, nrow=3, align='v')
Compile plot parts:
gg_left <- cowplot::plot_grid(ggs_annot$real, ggs_annot$rescued, nrow=2,
                              labels=c('B', 'C'))
gg_right <- gg_tsne + theme(plot.margin=margin(l=0.1, unit='in'),
                            axis.text=element_blank(), axis.ticks=element_blank())
gg_bottom <- cowplot::plot_grid(plotlist=gg_legends[c(1, 3, 2)], ncol=3,
                                rel_widths=c(1, 1, 2.6))

gg_filtration <- cowplot::plot_grid(gg_left, gg_right, labels=c('', 'D'), ncol=2) %>%
  cowplot::plot_grid(gg_bottom, nrow=2, rel_heights=c(1, 0.27), align='v')
coords <- list(optimal=list(x_l=est_cell_num$expected,
x_t=4000, y_l=3.2e5, y_t=5e5),
`10x`=list(x_l=ncol(cm_10x),
x_t=1300, y_l=2.5e5, y_t=4e5))
gg_repel <- function(coords, label) {
coords$label <- label
gg <- ggrepel::geom_label_repel(
data=as.data.frame(coords),
mapping=aes(x=x_l, y=y_l, label=label), nudge_x=coords$x_t - coords$x_l,
nudge_y=coords$y_t - coords$y_l, size=5.5, segment.size=0.7, force=0,
arrow=ggplot2::arrow(length = unit(0.03, 'npc')), fill=alpha("white", 0.7)
)
return(gg)
}
gg_cell_number <- PlotCellsNumberLine(Matrix::colSums(holder$cm_raw)) +
geom_vline(aes(xintercept=coords$`10x`$x_l), linetype='dashed',
color='#bc2727', size=1) +
geom_vline(aes(xintercept=coords$optimal$x_l), linetype='dashed',
color='#0a6607', size=1) +
gg_repel(coords$`10x`, label="10x threshold") +
gg_repel(coords$optimal, label="dropEst threshold") +
scale_x_continuous(limits=c(0, 5750), expand=c(0, 0)) +
theme_pdf() +
theme(axis.ticks=element_blank(), axis.text.y=element_blank(),
panel.grid.major.y=element_blank(), panel.grid.minor.y=element_blank())Final figure
gg_fig <- cowplot::plot_grid(gg_cell_number + theme(plot.margin=margin(b=0.1, unit="in")),
                             gg_filtration, nrow=2, rel_heights=c(1.2, 3),
                             labels=c('A', '')) +
  theme(plot.margin=margin(1, 1, 1, 1))

ggsave(paste0(kOutputFolder, 'figures/fig_bmmc_filtration.pdf'), gg_fig, width=7.5, height=7)

gg_fig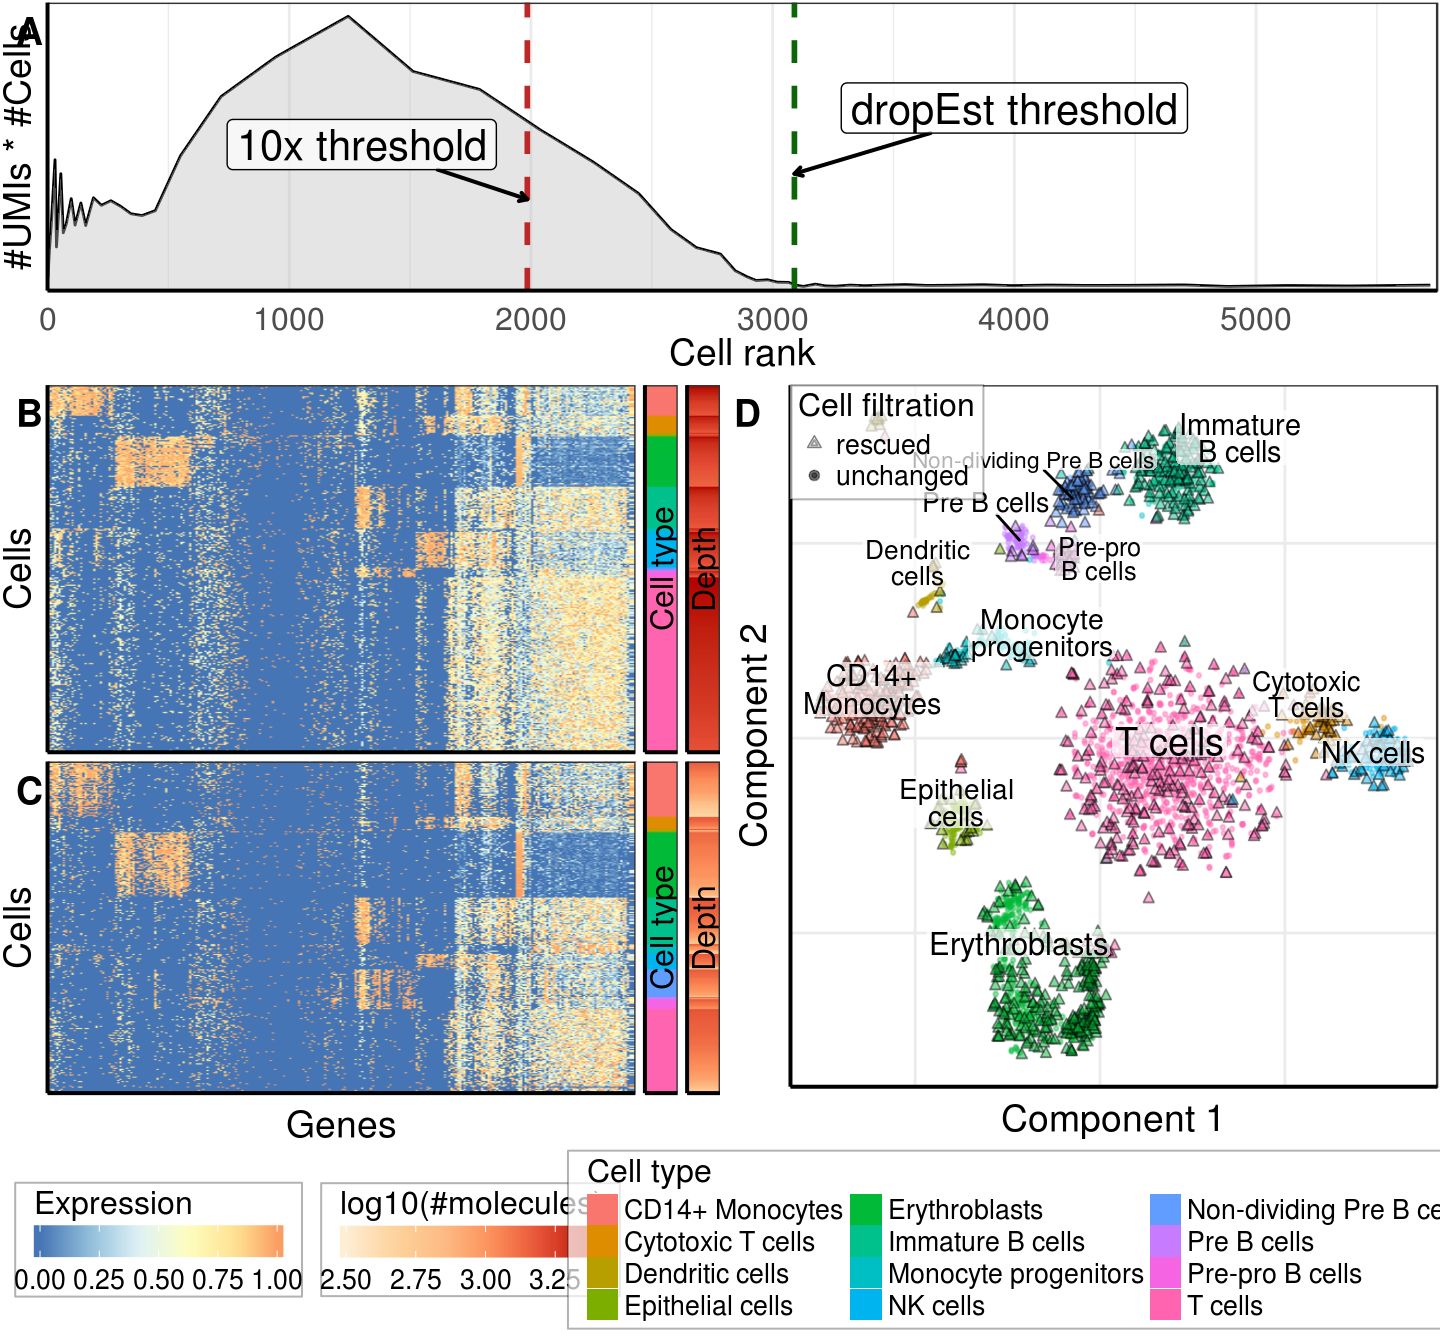
Session information
| value | |
|---|---|
| version | R version 3.4.1 (2017-06-30) |
| os | Ubuntu 14.04.5 LTS |
| system | x86_64, linux-gnu |
| ui | X11 |
| language | (EN) |
| collate | en_US.UTF-8 |
| tz | America/New_York |
| date | 2018-05-29 |
| package | loadedversion | date | source | |
|---|---|---|---|---|
| 1 | acepack | 1.4.1 | 2016-10-29 | CRAN (R 3.4.1) |
| 2 | AnnotationDbi | 1.32.3 | 2016-01-28 | Bioconductor |
| 3 | ape | 5.0 | 2017-10-30 | CRAN (R 3.4.1) |
| 4 | assertthat | 0.2.0 | 2017-04-11 | CRAN (R 3.4.1) |
| 5 | backports | 1.1.2 | 2017-12-13 | CRAN (R 3.4.1) |
| 7 | base64enc | 0.1-3 | 2015-07-28 | cran (@0.1-3) |
| 8 | bindr | 0.1 | 2016-11-13 | CRAN (R 3.4.1) |
| 9 | bindrcpp | 0.2 | 2017-06-17 | CRAN (R 3.4.1) |
| 10 | Biobase | 2.30.0 | 2016-01-28 | Bioconductor |
| 11 | BiocGenerics | 0.16.1 | 2016-01-28 | Bioconductor |
| 12 | bit | 1.1-12 | 2014-04-09 | CRAN (R 3.4.1) |
| 13 | bit64 | 0.9-7 | 2017-05-08 | CRAN (R 3.4.1) |
| 14 | bitops | 1.0-6 | 2013-08-17 | CRAN (R 3.4.1) |
| 15 | blob | 1.1.0 | 2017-06-17 | CRAN (R 3.4.1) |
| 16 | brew | 1.0-6 | 2011-04-13 | CRAN (R 3.4.1) |
| 17 | broom | 0.4.3 | 2017-11-20 | CRAN (R 3.4.1) |
| 18 | Cairo | 1.5-9 | 2015-09-26 | CRAN (R 3.4.1) |
| 19 | caret | 6.0-78 | 2017-12-10 | CRAN (R 3.4.1) |
| 20 | caTools | 1.17.1 | 2014-09-10 | CRAN (R 3.4.1) |
| 21 | checkmate | 1.8.5 | 2017-10-24 | CRAN (R 3.4.1) |
| 22 | class | 7.3-14 | 2015-08-30 | CRAN (R 3.4.0) |
| 23 | clisymbols | 1.2.0 | 2017-05-21 | CRAN (R 3.4.1) |
| 24 | cluster | 2.0.6 | 2017-03-16 | CRAN (R 3.4.0) |
| 25 | codetools | 0.2-15 | 2016-10-05 | CRAN (R 3.4.1) |
| 26 | colorspace | 1.3-2 | 2016-12-14 | CRAN (R 3.4.1) |
| 28 | cowplot | 0.9.2 | 2017-12-17 | CRAN (R 3.4.1) |
| 29 | CVST | 0.2-1 | 2013-12-10 | CRAN (R 3.4.1) |
| 30 | data.table | 1.10.4-3 | 2017-10-27 | CRAN (R 3.4.1) |
| 32 | DBI | 1.0.0 | 2018-05-02 | CRAN (R 3.4.1) |
| 33 | ddalpha | 1.3.1 | 2017-09-27 | CRAN (R 3.4.1) |
| 34 | dendsort | 0.3.3 | 2015-12-14 | cran (@0.3.3) |
| 35 | DEoptimR | 1.0-8 | 2016-11-19 | CRAN (R 3.4.1) |
| 36 | diffusionMap | 1.1-0 | 2014-02-20 | CRAN (R 3.4.1) |
| 37 | digest | 0.6.15 | 2018-01-28 | cran (@0.6.15) |
| 38 | dimRed | 0.1.0 | 2017-05-04 | CRAN (R 3.4.1) |
| 39 | diptest | 0.75-7 | 2016-12-05 | CRAN (R 3.4.1) |
| 40 | doParallel | 1.0.11 | 2017-09-28 | CRAN (R 3.4.1) |
| 41 | dplyr | 0.7.4 | 2017-09-28 | CRAN (R 3.4.1) |
| 42 | dropEstAnalysis | 0.6.0 | 2018-05-16 | local (VPetukhov/dropEstAnalysis@NA) |
| 43 | dropestr | 0.7.7 | 2018-03-17 | local (@0.7.7) |
| 44 | DRR | 0.0.2 | 2016-09-15 | CRAN (R 3.4.1) |
| 45 | dtw | 1.18-1 | 2015-09-01 | CRAN (R 3.4.1) |
| 46 | evaluate | 0.10.1 | 2017-06-24 | CRAN (R 3.4.1) |
| 47 | flexmix | 2.3-14 | 2017-04-28 | CRAN (R 3.4.1) |
| 48 | FNN | 1.1 | 2013-07-31 | CRAN (R 3.4.1) |
| 49 | foreach | 1.4.4 | 2017-12-12 | CRAN (R 3.4.1) |
| 50 | foreign | 0.8-69 | 2017-06-21 | CRAN (R 3.4.0) |
| 51 | Formula | 1.2-2 | 2017-07-10 | CRAN (R 3.4.1) |
| 52 | fpc | 2.1-10 | 2015-08-14 | CRAN (R 3.4.1) |
| 53 | gdata | 2.18.0 | 2017-06-06 | CRAN (R 3.4.1) |
| 54 | ggjoy | 0.4.0 | 2017-09-15 | CRAN (R 3.4.1) |
| 55 | ggplot2 | 2.2.1 | 2016-12-30 | CRAN (R 3.4.1) |
| 56 | ggpubr | 0.1.6 | 2017-11-14 | CRAN (R 3.4.1) |
| 57 | ggrastr | 0.1.5 | 2017-12-28 | Github (VPetukhov/ggrastr@cc56b45) |
| 58 | ggrepel | 0.7.0 | 2017-09-29 | CRAN (R 3.4.1) |
| 59 | ggridges | 0.4.1 | 2017-09-15 | CRAN (R 3.4.1) |
| 60 | git2r | 0.21.0 | 2018-01-04 | cran (@0.21.0) |
| 61 | glue | 1.2.0 | 2017-10-29 | CRAN (R 3.4.1) |
| 62 | GO.db | 3.2.2 | 2017-11-12 | Bioconductor |
| 63 | gower | 0.1.2 | 2017-02-23 | CRAN (R 3.4.1) |
| 64 | gplots | 3.0.1 | 2016-03-30 | CRAN (R 3.4.1) |
| 68 | gridBase | 0.4-7 | 2014-02-24 | CRAN (R 3.4.1) |
| 69 | gridExtra | 2.3 | 2017-09-09 | CRAN (R 3.4.1) |
| 70 | gtable | 0.2.0 | 2016-02-26 | CRAN (R 3.4.1) |
| 71 | gtools | 3.5.0 | 2015-05-29 | CRAN (R 3.4.1) |
| 72 | highr | 0.6 | 2016-05-09 | CRAN (R 3.4.1) |
| 73 | Hmisc | 4.0-3 | 2017-05-02 | CRAN (R 3.4.1) |
| 74 | htmlTable | 1.11.0 | 2017-12-01 | CRAN (R 3.4.1) |
| 75 | htmltools | 0.3.6 | 2017-04-28 | CRAN (R 3.4.1) |
| 76 | htmlwidgets | 1.0 | 2018-01-20 | cran (@1.0) |
| 77 | ica | 1.0-1 | 2015-08-25 | CRAN (R 3.4.1) |
| 78 | igraph | 1.2.1 | 2018-03-10 | cran (@1.2.1) |
| 79 | ipred | 0.9-6 | 2017-03-01 | CRAN (R 3.4.1) |
| 80 | IRanges | 2.4.8 | 2016-09-15 | Bioconductor |
| 81 | irlba | 2.3.2 | 2018-01-11 | cran (@2.3.2) |
| 82 | iterators | 1.0.9 | 2017-12-12 | CRAN (R 3.4.1) |
| 83 | kernlab | 0.9-25 | 2016-10-03 | CRAN (R 3.4.1) |
| 84 | KernSmooth | 2.23-15 | 2015-06-29 | CRAN (R 3.4.0) |
| 85 | knitr | 1.20 | 2018-02-20 | cran (@1.20) |
| 86 | ks | 1.11.0 | 2018-01-16 | local (VPetukhov/ks@NA) |
| 87 | labeling | 0.3 | 2014-08-23 | CRAN (R 3.4.1) |
| 88 | lars | 1.2 | 2013-04-24 | CRAN (R 3.4.1) |
| 89 | lattice | 0.20-35 | 2017-03-25 | CRAN (R 3.4.1) |
| 90 | latticeExtra | 0.6-28 | 2016-02-09 | CRAN (R 3.4.1) |
| 91 | lava | 1.5.1 | 2017-09-27 | CRAN (R 3.4.1) |
| 92 | lazyeval | 0.2.1 | 2017-10-29 | CRAN (R 3.4.1) |
| 93 | lubridate | 1.7.1 | 2017-11-03 | CRAN (R 3.4.1) |
| 94 | magrittr | 1.5 | 2014-11-22 | CRAN (R 3.4.1) |
| 95 | MASS | 7.3-47 | 2017-04-21 | CRAN (R 3.4.0) |
| 96 | Matrix | 1.2-12 | 2017-11-16 | CRAN (R 3.4.1) |
| 97 | mclust | 5.4 | 2017-11-22 | CRAN (R 3.4.1) |
| 98 | memoise | 1.1.0 | 2017-04-21 | CRAN (R 3.4.1) |
| 100 | mgcv | 1.8-22 | 2017-09-19 | CRAN (R 3.4.1) |
| 101 | mixtools | 1.1.0 | 2017-03-10 | CRAN (R 3.4.1) |
| 102 | mnormt | 1.5-5 | 2016-10-15 | CRAN (R 3.4.1) |
| 103 | ModelMetrics | 1.1.0 | 2016-08-26 | CRAN (R 3.4.1) |
| 104 | modeltools | 0.2-21 | 2013-09-02 | CRAN (R 3.4.1) |
| 105 | munsell | 0.4.3 | 2016-02-13 | CRAN (R 3.4.1) |
| 106 | mvtnorm | 1.0-7 | 2018-01-26 | cran (@1.0-7) |
| 107 | nlme | 3.1-131 | 2017-02-06 | CRAN (R 3.4.0) |
| 108 | NMF | 0.20.6 | 2015-05-26 | CRAN (R 3.4.1) |
| 109 | nnet | 7.3-12 | 2016-02-02 | CRAN (R 3.4.0) |
| 110 | numDeriv | 2016.8-1 | 2016-08-27 | CRAN (R 3.4.1) |
| 111 | pagoda2 | 0.0.0.9002 | 2018-04-08 | local (hms-dbmi/pagoda2@NA) |
| 113 | pbapply | 1.3-3 | 2017-07-04 | CRAN (R 3.4.1) |
| 114 | pcaMethods | 1.60.0 | 2017-11-12 | Bioconductor |
| 115 | pcaPP | 1.9-73 | 2018-01-14 | cran (@1.9-73) |
| 116 | pkgconfig | 2.0.1 | 2017-03-21 | CRAN (R 3.4.1) |
| 117 | pkgmaker | 0.22 | 2014-05-14 | CRAN (R 3.4.1) |
| 118 | plyr | 1.8.4 | 2016-06-08 | CRAN (R 3.4.1) |
| 119 | prabclus | 2.2-6 | 2015-01-14 | CRAN (R 3.4.1) |
| 120 | prodlim | 1.6.1 | 2017-03-06 | CRAN (R 3.4.1) |
| 121 | proxy | 0.4-20 | 2017-12-12 | CRAN (R 3.4.1) |
| 122 | psych | 1.7.8 | 2017-09-09 | CRAN (R 3.4.1) |
| 123 | purrr | 0.2.4 | 2017-10-18 | CRAN (R 3.4.1) |
| 124 | R.methodsS3 | 1.7.1 | 2016-02-16 | CRAN (R 3.4.1) |
| 125 | R.oo | 1.21.0 | 2016-11-01 | CRAN (R 3.4.1) |
| 126 | R.utils | 2.6.0 | 2017-11-05 | CRAN (R 3.4.1) |
| 127 | R6 | 2.2.2 | 2017-06-17 | CRAN (R 3.4.1) |
| 128 | ranger | 0.8.0 | 2017-06-20 | CRAN (R 3.4.1) |
| 129 | RColorBrewer | 1.1-2 | 2014-12-07 | CRAN (R 3.4.1) |
| 130 | Rcpp | 0.12.17 | 2018-05-18 | cran (@0.12.17) |
| 131 | RcppRoll | 0.2.2 | 2015-04-05 | CRAN (R 3.4.1) |
| 132 | recipes | 0.1.1 | 2017-11-20 | CRAN (R 3.4.1) |
| 133 | registry | 0.5 | 2017-12-03 | CRAN (R 3.4.1) |
| 134 | reshape2 | 1.4.3 | 2017-12-11 | CRAN (R 3.4.1) |
| 135 | rjson | 0.2.19 | 2018-05-18 | cran (@0.2.19) |
| 136 | rlang | 0.1.4 | 2017-11-05 | CRAN (R 3.4.1) |
| 137 | rmarkdown | 1.9 | 2018-03-01 | CRAN (R 3.4.1) |
| 138 | rngtools | 1.2.4 | 2014-03-06 | CRAN (R 3.4.1) |
| 139 | robustbase | 0.92-8 | 2017-11-01 | CRAN (R 3.4.1) |
| 140 | ROCR | 1.0-7 | 2015-03-26 | CRAN (R 3.4.1) |
| 141 | Rook | 1.1-1 | 2014-10-20 | CRAN (R 3.4.1) |
| 142 | rpart | 4.1-11 | 2017-04-21 | CRAN (R 3.4.0) |
| 143 | rprojroot | 1.3-2 | 2018-01-03 | cran (@1.3-2) |
| 144 | RSQLite | 2.0 | 2017-06-19 | CRAN (R 3.4.1) |
| 145 | rstudioapi | 0.7 | 2017-09-07 | CRAN (R 3.4.1) |
| 146 | Rtsne | 0.14 | 2017-11-12 | Github (jkrijthe/Rtsne@1d0f926) |
| 147 | S4Vectors | 0.8.11 | 2016-01-30 | Bioconductor |
| 148 | scales | 0.5.0 | 2017-08-24 | CRAN (R 3.4.1) |
| 149 | scatterplot3d | 0.3-40 | 2017-04-22 | CRAN (R 3.4.1) |
| 150 | SDMTools | 1.1-221 | 2014-08-05 | CRAN (R 3.4.1) |
| 151 | segmented | 0.5-3.0 | 2017-11-30 | CRAN (R 3.4.1) |
| 152 | sessioninfo | 1.0.0 | 2017-06-21 | CRAN (R 3.4.1) |
| 153 | Seurat | 2.1.0 | 2017-10-12 | CRAN (R 3.4.1) |
| 154 | sfsmisc | 1.1-1 | 2017-06-08 | CRAN (R 3.4.1) |
| 155 | sn | 1.5-1 | 2017-11-23 | CRAN (R 3.4.1) |
| 159 | stringi | 1.1.7 | 2018-03-12 | cran (@1.1.7) |
| 160 | stringr | 1.3.0 | 2018-02-19 | cran (@1.3.0) |
| 161 | survival | 2.41-3 | 2017-04-04 | CRAN (R 3.4.0) |
| 162 | tclust | 1.3-1 | 2017-08-24 | CRAN (R 3.4.1) |
| 163 | tibble | 1.3.4 | 2017-08-22 | CRAN (R 3.4.1) |
| 164 | tidyr | 0.7.2 | 2017-10-16 | CRAN (R 3.4.1) |
| 165 | tidyselect | 0.2.3 | 2017-11-06 | CRAN (R 3.4.1) |
| 166 | timeDate | 3042.101 | 2017-11-16 | CRAN (R 3.4.1) |
| 168 | triebeard | 0.3.0 | 2016-08-04 | cran (@0.3.0) |
| 169 | trimcluster | 0.1-2 | 2012-10-29 | CRAN (R 3.4.1) |
| 170 | tsne | 0.1-3 | 2016-07-15 | CRAN (R 3.4.1) |
| 171 | urltools | 1.7.0 | 2018-01-20 | cran (@1.7.0) |
| 173 | VGAM | 1.0-4 | 2017-07-25 | CRAN (R 3.4.1) |
| 174 | withr | 2.1.2 | 2018-03-15 | cran (@2.1.2) |
| 175 | xtable | 1.8-2 | 2016-02-05 | CRAN (R 3.4.1) |
| 176 | yaml | 2.1.18 | 2018-03-08 | cran (@2.1.18) |
This R Markdown site was created with workflowr