Annotation of 10x Frozen BMMCs (Healthy Control 1) dataset
Viktor Petukhov
2018-01-23
Source file: notebooks/annotation/annotation_bmmc1.Rmd
Last updated: 2018-05-29
Code version: 3ea6d7c
library(ggplot2)
library(dplyr)
library(dropestr)
library(dropEstAnalysis)
library(Matrix)

theme_set(theme_base)

set.seed(42)
kDropEstData <- '../../data/dropest/10x/frozen_bmmc_healthy_donor1/'
kEstFolder <- paste0(kDropEstData, 'est_11_10_umi_quality/')
k10xFolder <- paste0(kDropEstData, 'filtered_matrices_mex/hg19/')
kAnnotationData <- '../../data/annotation/'
kOutputPath <- '../../output/'
Read data
holder <- readRDS(paste0(kEstFolder, 'bmmc_no_umi.rds'))
genes <- read.table(paste0(k10xFolder, 'genes.tsv')) %>%
  filter(V2 %in% names(which(table(V2) == 1)))
gene_id_to_names <- setNames(genes$V2, genes$V1)
holder$cm <- holder$cm[grep("^[^;]+$", rownames(holder$cm)),]
holder$cm_raw <- holder$cm_raw[grep("^[^;]+$", rownames(holder$cm_raw)),]
umis_per_cell <- sort(Matrix::colSums(holder$cm_raw), decreasing=T)
est_cell_num <- EstimateCellsNumber(umis_per_cell)Quality scores:
scores <- ScorePipelineCells(holder, mit.chromosome.name='MT',
                             predict.all=T, verbose=T)[names(umis_per_cell)]
Explained variance after PCA: 99.05%; used 3 PCs.
Used features: ReadsPerUmi, LowExpressedGenesFrac, IntergenicFrac.PlotCellScores(scores, cells.number=est_cell_num)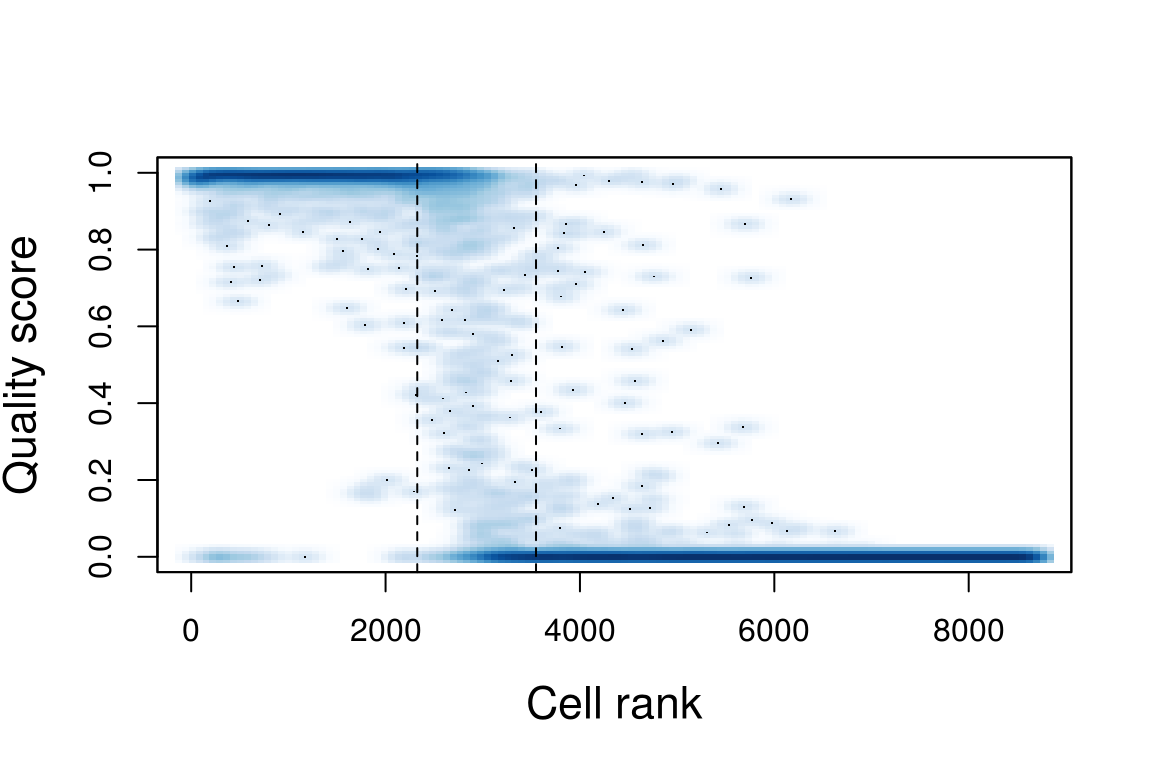
Pagoda run:
real_cbs <- names(scores)[1:est_cell_num$expected]
real_cbs <- real_cbs[scores[real_cbs] > 0.5]
real_cbs <- union(names(scores)[scores > 0.9], real_cbs)

r_cm <- holder$cm_raw[, real_cbs]
r_cm <- r_cm[intersect(rownames(r_cm), names(gene_id_to_names)), ]
rownames(r_cm) <- gene_id_to_names[rownames(r_cm)]

pgd <- GetPagoda(r_cm, n.cores=30, tsne.iter.num=5000)
2920 cells, 7949 genes; normalizing ... using plain model winsorizing ... log scale ... done.
calculating variance fit ... using gam 148 overdispersed genes ... 148 persisting ... done.
running PCA using 1000 OD genes .... done
calculating distance ... pearson ...running tSNE using 30 cores:# clusters <- pgd$clusters$PCA$infomap
# write.csv(clusters, paste0(kAnnotationData, 'bmmc1_clusters.csv'))
# Pagoda uses stochastic clustering algorithm, so we saved clusters from one run
clusters <- read.csv(paste0(kAnnotationData, 'bmmc1_clusters.csv'), row.names=1)
clusters <- setNames(clusters$x, rownames(clusters))
log_mtx <- log10(1e-3 + as.matrix(pgd$counts[names(clusters), ]))Initial clustering:
PlotPagodaEmbeding(pgd, clusters=clusters, show.ticks=F)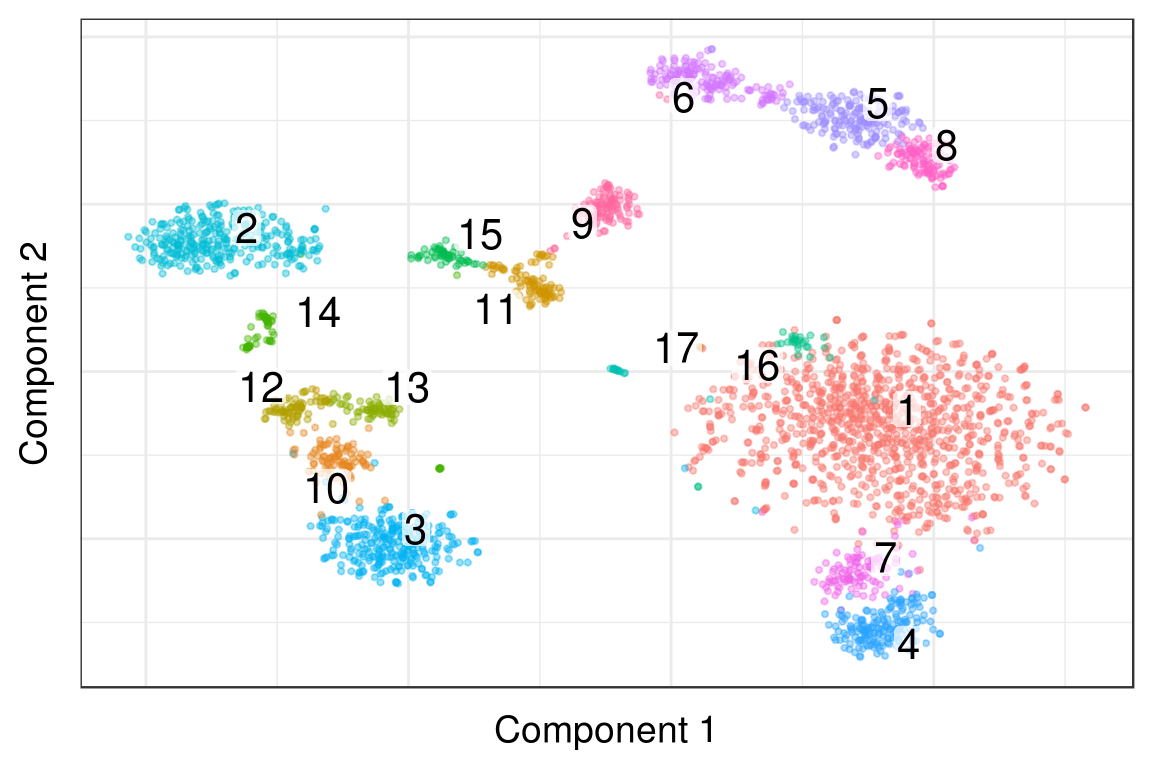
Initial labeling
Description:
* https://www.bdbiosciences.com/documents/Bcell_Brochure.pdf - B cells
* https://www.bdbiosciences.com/documents/cd_marker_handbook.pdf - CD Markers
de_genes <- pgd$getDifferentialGenes(type='PCA', groups=clusters,
                                     upregulated.only=T) %>% lapply(rownames)

major_cell_types <- lst(
  `T cells` = sapply(de_genes, function(genes) 'CD3D' %in% genes) %>%
    which() %>% names() %>% as.integer(),
  `B cells` = sapply(de_genes, function(genes) 'MS4A1' %in% genes) %>%
    which() %>% names() %>% as.integer()
)

major_type_clusts <- major_cell_types %>% unlist()
if (length(major_type_clusts) != length(unique(major_type_clusts)))
  stop("Something goes wrong")
heatmap_genes <- c(
'CD19', 'MME', 'MS4A1',
'CD3D',
'LYZ', 'CD14',
'GZMA', 'GZMB', 'GNLY', 'NKG7',
'FCER1A', 'CST3',
'CD34', 'PTPRC', 'ITGB1', 'ENG',
'EPCAM', 'APOE',
'GYPA', 'CD36', 'TFRC'
)
heatmap_clusters <- clusters[!(clusters %in% unlist(major_cell_types))]
heatmap_clusters <- heatmap_clusters[heatmap_clusters > 9]
PlotExpressionHeatmap(log_mtx, heatmap_clusters, heatmap_genes)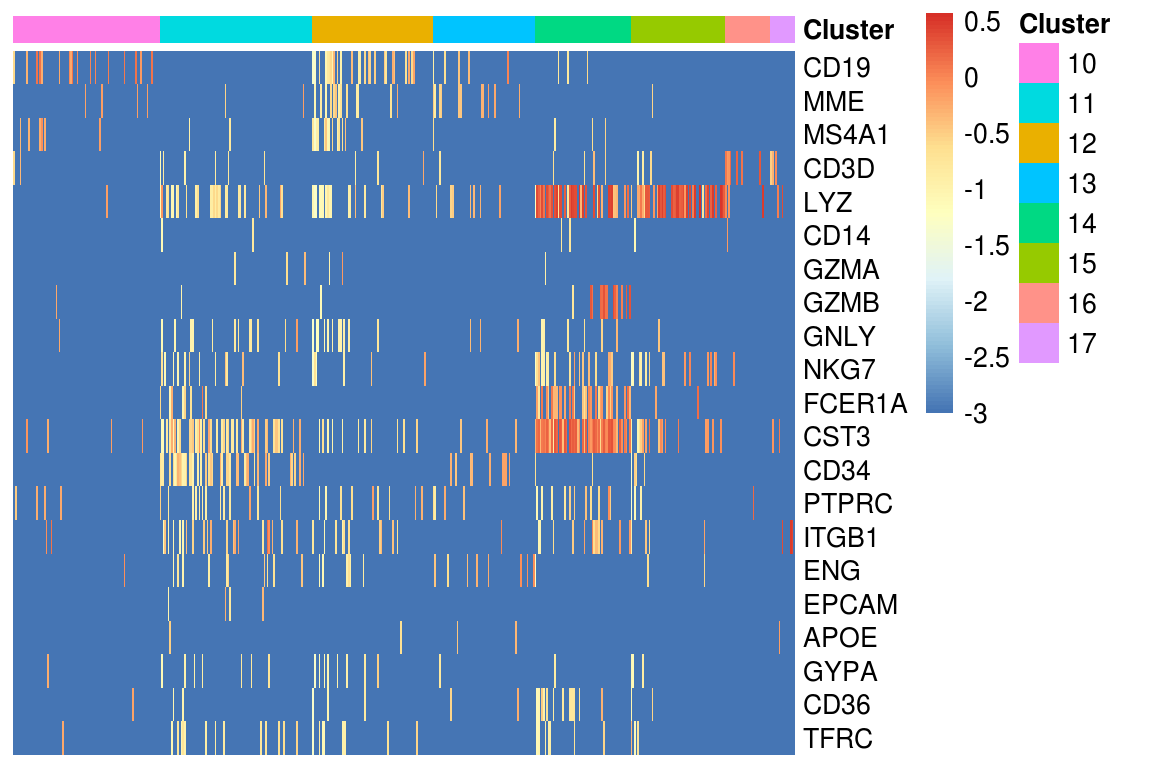
type_ids <- c(major_cell_types, lst(
  `CD14+ Monocytes` = c(2),
  `NK cells` = c(4),
  `Dendritic cells` = c(14),
  `Monocyte progenitors` = c(11, 15),
  `Epithelial cells` = c(9),
  `Erythroblasts` = c(5, 6, 8)
))

type_ids$`B cells` <- c(type_ids$`B cells`, 10, 12:13)
type_ids$`T cells` <- c(type_ids$`T cells`, 16:17)

markers_df <- data.frame(
  Type = c("B cells", "T cells", "CD14+ Monocytes", "NK cells", "Dendritic cells",
           "Monocyte progenitors", "Epithelial cells", "Erythroblasts"),
  Markers = c("CD19, MME (CD10), MS4A1 (CD20)", "CD3D",
              "LYZ, CD14", "GZMA, GZMB, GNLY, NKG7", "FCER1A, CST3",
              "LYZ, CD34",
              "EPCAM (CD326), CD226-, APOE (CD165)", "GYPA (CD235a), CD36, TFRC (CD71)")
)

markers_df$Clusters <- sapply(type_ids, paste, collapse=", ")[as.character(markers_df$Type)]
markers_df| Type | Markers | Clusters |
|---|---|---|
| B cells | CD19, MME (CD10), MS4A1 (CD20) | 3, 10, 12, 13 |
| T cells | CD3D | 1, 7, 16, 17 |
| CD14+ Monocytes | LYZ, CD14 | 2 |
| NK cells | GZMA, GZMB, GNLY, NKG7 | 4 |
| Dendritic cells | FCER1A, CST3 | 14 |
| Monocyte progenitors | LYZ, CD34 | 11, 15 |
| Epithelial cells | EPCAM (CD326), CD226-, APOE (CD165) | 9 |
| Erythroblasts | GYPA (CD235a), CD36, TFRC (CD71) | 5, 6, 8 |
clusters_annotated <- AnnotateClusters(clusters, type_ids)
PlotClustering(pgd, clusters_annotated)
B cells
heatmap_genes <- c(
  'MS4A1', 'CD40', 'IL4R', 'IL7R',
  'CD34', 'CD38', 'MME',
  'CD19',
  'CD37', 'IGLL5')

heatmap_clusters <- clusters[clusters %in% type_ids$`B cells`]
# heatmap_clusters <- heatmap_clusters[heatmap_clusters > 9]
PlotExpressionHeatmap(log_mtx, heatmap_clusters, heatmap_genes)
b_markers_df <- data.frame(
  Type = c("Immature B cells", "Pre-pro B cells", "Pre B cells", "Non-dividing Pre B cells"),
  Markers = c("MS4A1 (CD20), CD40, IL4R, IL7R-", "CD34, CD38, MME (CD10), CD24-, IL7R-",
              "CD34-, CD40-, IL7R+, IL4R-, CD19+", "CD34, IGLL5")
)

type_ids <- c(type_ids, lst(
  `Immature B cells` = c(3),
  `Pre-pro B cells` = c(13),
  `Non-dividing Pre B cells` = c(10),
  `Pre B cells` = c(12)
  ))

type_ids$`B cells` <- NULL

b_markers_df$Clusters <- sapply(type_ids, paste, collapse=", ")[as.character(b_markers_df$Type)]
b_markers_df| Type | Markers | Clusters |
|---|---|---|
| Immature B cells | MS4A1 (CD20), CD40, IL4R, IL7R- | 3 |
| Pre-pro B cells | CD34, CD38, MME (CD10), CD24-, IL7R- | 13 |
| Pre B cells | CD34-, CD40-, IL7R+, IL4R-, CD19+ | 12 |
| Non-dividing Pre B cells | CD34, IGLL5 | 10 |
T cells
heatmap_genes <- c('CCR7', "CD3E", "CD8B", "SELL", "GNLY", "GZMA", "GZMB", "GZMH",
                   "GZMK", "PRF1", "NKG7", "IL7R", "CD4")

heatmap_clusters <- clusters[clusters %in% type_ids$`T cells`]
PlotExpressionHeatmap(log_mtx, heatmap_clusters, heatmap_genes)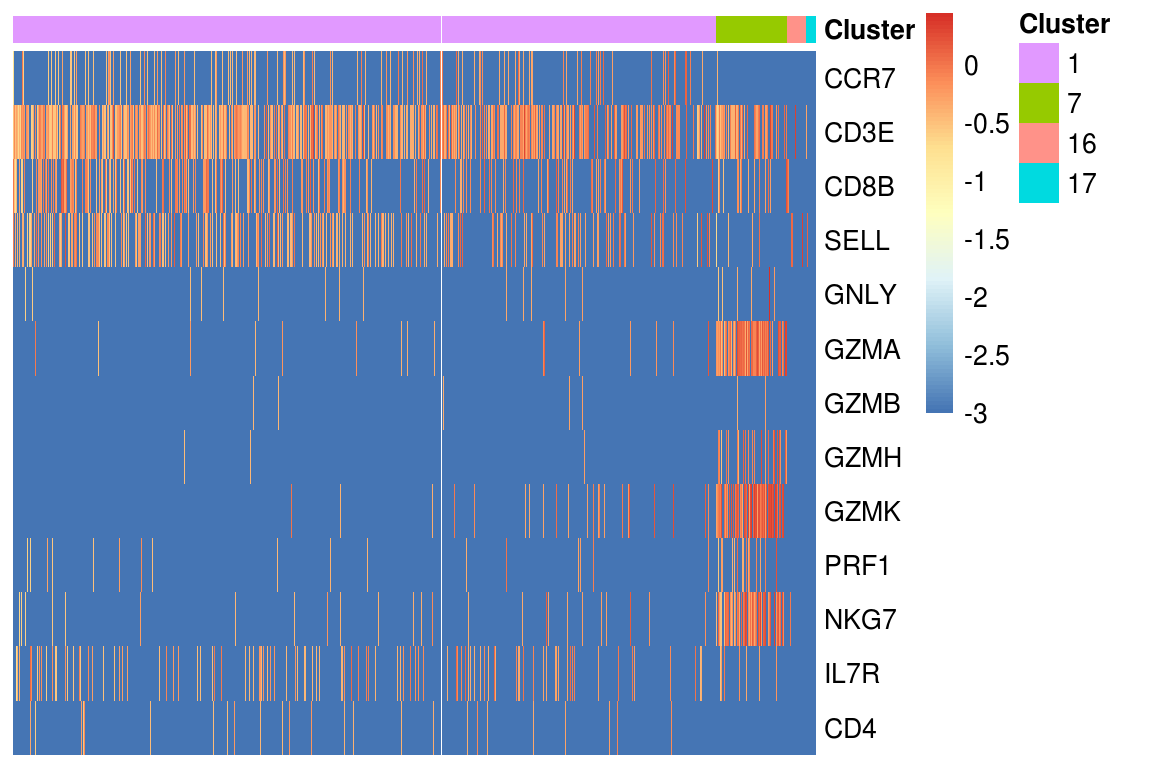
t_markers_df <- data.frame(
  Type = c("Cytotoxic T cells", "T cells"),
  Markers = c("NKG7, GZMA, GZMH, GZMK", "CD3E, CD8B, IL7R")
)

type_ids <- c(type_ids, lst(
  `Cytotoxic T cells` = c(7)
))

type_ids$`T cells` <- setdiff(type_ids$`T cells`, type_ids$`Cytotoxic T cells`)

t_markers_df$Clusters <- sapply(type_ids, paste, collapse=", ")[as.character(t_markers_df$Type)]
t_markers_df| Type | Markers | Clusters |
|---|---|---|
| Cytotoxic T cells | NKG7, GZMA, GZMH, GZMK | 7 |
| T cells | CD3E, CD8B, IL7R | 1, 16, 17 |
clusters_annotated <- AnnotateClusters(clusters, type_ids)
write.csv(data.frame(Barcode=names(clusters_annotated),
                     Type=as.vector(clusters_annotated)),
          paste0(kAnnotationData, 'bmmc1_clusters_annotated.csv'))
All markers
all_markers_df <- bind_rows(list(markers_df, t_markers_df, b_markers_df))
write.csv(all_markers_df[c('Type', 'Markers')],
          paste0(kOutputPath, 'tables/annotation_bmmc1_markers.csv'), row.names=F)
all_markers_df| Type | Markers | Clusters |
|---|---|---|
| B cells | CD19, MME (CD10), MS4A1 (CD20) | 3, 10, 12, 13 |
| T cells | CD3D | 1, 7, 16, 17 |
| CD14+ Monocytes | LYZ, CD14 | 2 |
| NK cells | GZMA, GZMB, GNLY, NKG7 | 4 |
| Dendritic cells | FCER1A, CST3 | 14 |
| Monocyte progenitors | LYZ, CD34 | 11, 15 |
| Epithelial cells | EPCAM (CD326), CD226-, APOE (CD165) | 9 |
| Erythroblasts | GYPA (CD235a), CD36, TFRC (CD71) | 5, 6, 8 |
| Cytotoxic T cells | NKG7, GZMA, GZMH, GZMK | 7 |
| T cells | CD3E, CD8B, IL7R | 1, 16, 17 |
| Immature B cells | MS4A1 (CD20), CD40, IL4R, IL7R- | 3 |
| Pre-pro B cells | CD34, CD38, MME (CD10), CD24-, IL7R- | 13 |
| Pre B cells | CD34-, CD40-, IL7R+, IL4R-, CD19+ | 12 |
| Non-dividing Pre B cells | CD34, IGLL5 | 10 |
Expression plots
plot_mtx <- apply(log_mtx, 2, function(vec) scales::rescale(rank(vec)))raster_width <- 8 / 3
raster_height <- 8 / 4
raster_dpi <- 150
clusters_annotated <- AnnotateClusters(clusters, type_ids)
plot_clusters_annotated <- clusters_annotated
long_type_names <- c("CD14+ Monocytes", "Non-dividing Pre B cells", "Monocyte progenitors",
"Epithelial cells", "Cytotoxic T cells", "Immature B cells",
"Dendritic cells", "Pre-pro B cells")
for (type in long_type_names) {
plot_clusters_annotated[plot_clusters_annotated == type] <- sub(" ", "\n", type)
}
gg_annotated <- PlotClustering(pgd, plot_clusters_annotated, lineheight=0.9, size=0.3,
raster=T, raster.width=raster_width,
raster.height=raster_height, raster.dpi=raster_dpi) +
scale_size_continuous(range=c(2, 3)) +
theme(axis.title=element_blank(), plot.margin=margin())plot_genes <- c('CD3D', 'NKG7',
'MS4A1', 'IGLL5', 'CD37',
'GYPA', 'EPCAM',
'FCER1A', 'CD14', 'LYZ', 'CD34')
gene_plots <- lapply(plot_genes, PlotGeneFraction, pgd, plot_mtx, title.x=0.04,
title.y=0.99, legend.position="none", size=0.3,
raster=T, raster.width=raster_width,
raster.height=raster_height, raster.dpi=raster_dpi)
gene_plots <- c(list(gg_annotated), gene_plots)gg_fig <- cowplot::plot_grid(plotlist=gene_plots, ncol=3) +
theme(plot.margin=margin(1, 1, 1, 1))gg_fig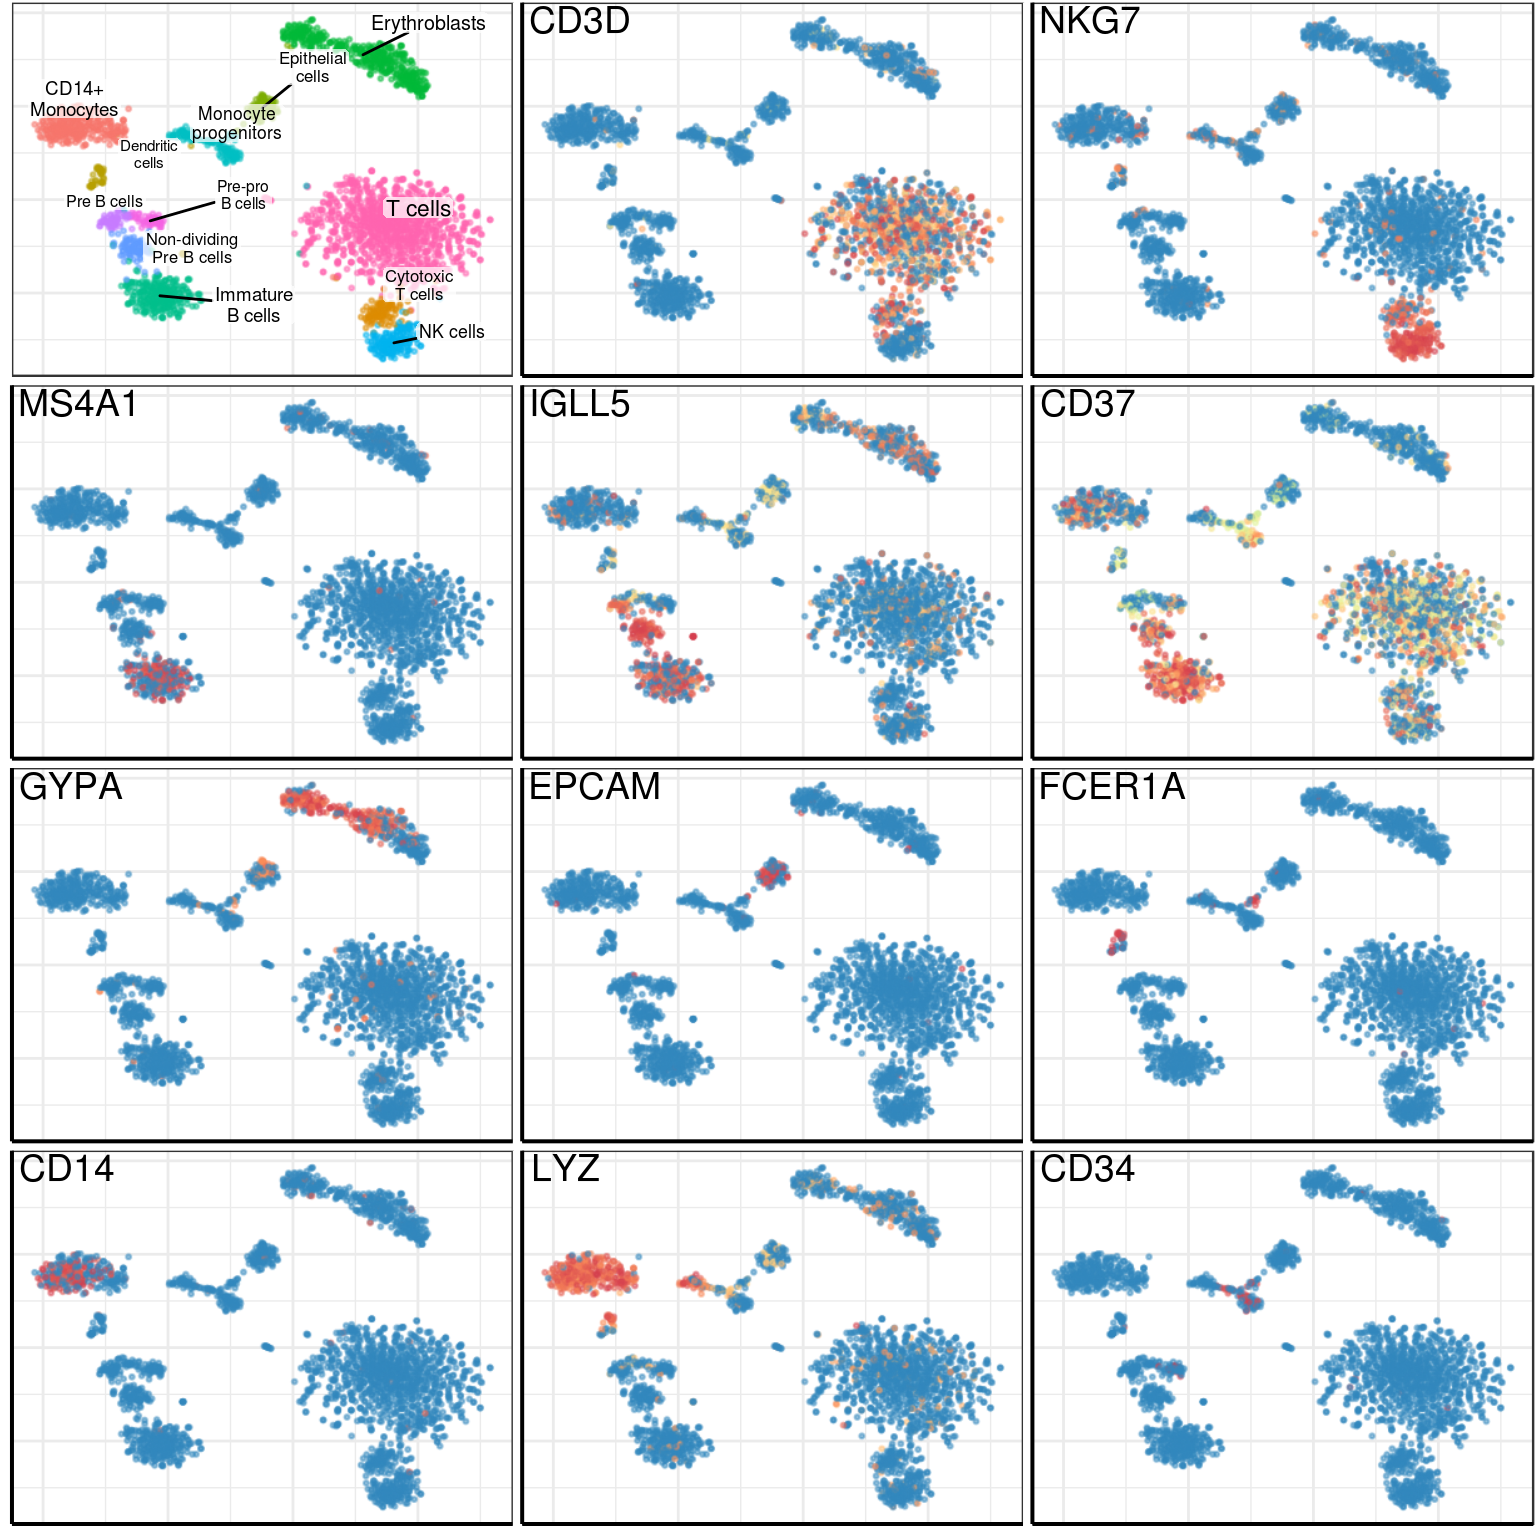
ggsave(paste0(kOutputPath, 'figures/supp_annotation_bmmc1.pdf'), width=8, height=8)Session information
| value | |
|---|---|
| version | R version 3.4.1 (2017-06-30) |
| os | Ubuntu 14.04.5 LTS |
| system | x86_64, linux-gnu |
| ui | X11 |
| language | (EN) |
| collate | en_US.UTF-8 |
| tz | America/New_York |
| date | 2018-05-29 |
| package | loadedversion | date | source | |
|---|---|---|---|---|
| 1 | AnnotationDbi | 1.32.3 | 2016-01-28 | Bioconductor |
| 2 | assertthat | 0.2.0 | 2017-04-11 | CRAN (R 3.4.1) |
| 3 | backports | 1.1.2 | 2017-12-13 | CRAN (R 3.4.1) |
| 5 | base64enc | 0.1-3 | 2015-07-28 | cran (@0.1-3) |
| 6 | bindr | 0.1 | 2016-11-13 | CRAN (R 3.4.1) |
| 7 | bindrcpp | 0.2 | 2017-06-17 | CRAN (R 3.4.1) |
| 8 | Biobase | 2.30.0 | 2016-01-28 | Bioconductor |
| 9 | BiocGenerics | 0.16.1 | 2016-01-28 | Bioconductor |
| 10 | bit | 1.1-12 | 2014-04-09 | CRAN (R 3.4.1) |
| 11 | bit64 | 0.9-7 | 2017-05-08 | CRAN (R 3.4.1) |
| 12 | blob | 1.1.0 | 2017-06-17 | CRAN (R 3.4.1) |
| 13 | brew | 1.0-6 | 2011-04-13 | CRAN (R 3.4.1) |
| 14 | Cairo | 1.5-9 | 2015-09-26 | CRAN (R 3.4.1) |
| 15 | clisymbols | 1.2.0 | 2017-05-21 | CRAN (R 3.4.1) |
| 16 | colorspace | 1.3-2 | 2016-12-14 | CRAN (R 3.4.1) |
| 18 | cowplot | 0.9.2 | 2017-12-17 | CRAN (R 3.4.1) |
| 20 | DBI | 1.0.0 | 2018-05-02 | CRAN (R 3.4.1) |
| 21 | dendsort | 0.3.3 | 2015-12-14 | cran (@0.3.3) |
| 22 | digest | 0.6.15 | 2018-01-28 | cran (@0.6.15) |
| 23 | dplyr | 0.7.4 | 2017-09-28 | CRAN (R 3.4.1) |
| 24 | dropEstAnalysis | 0.6.0 | 2018-05-16 | local (VPetukhov/dropEstAnalysis@NA) |
| 25 | dropestr | 0.7.7 | 2018-03-17 | local (@0.7.7) |
| 26 | evaluate | 0.10.1 | 2017-06-24 | CRAN (R 3.4.1) |
| 27 | ggplot2 | 2.2.1 | 2016-12-30 | CRAN (R 3.4.1) |
| 28 | ggrastr | 0.1.5 | 2017-12-28 | Github (VPetukhov/ggrastr@cc56b45) |
| 29 | ggrepel | 0.7.0 | 2017-09-29 | CRAN (R 3.4.1) |
| 30 | git2r | 0.21.0 | 2018-01-04 | cran (@0.21.0) |
| 31 | glue | 1.2.0 | 2017-10-29 | CRAN (R 3.4.1) |
| 32 | GO.db | 3.2.2 | 2017-11-12 | Bioconductor |
| 36 | gtable | 0.2.0 | 2016-02-26 | CRAN (R 3.4.1) |
| 37 | highr | 0.6 | 2016-05-09 | CRAN (R 3.4.1) |
| 38 | htmltools | 0.3.6 | 2017-04-28 | CRAN (R 3.4.1) |
| 39 | igraph | 1.2.1 | 2018-03-10 | cran (@1.2.1) |
| 40 | IRanges | 2.4.8 | 2016-09-15 | Bioconductor |
| 41 | irlba | 2.3.2 | 2018-01-11 | cran (@2.3.2) |
| 42 | KernSmooth | 2.23-15 | 2015-06-29 | CRAN (R 3.4.0) |
| 43 | knitr | 1.20 | 2018-02-20 | cran (@1.20) |
| 44 | ks | 1.11.0 | 2018-01-16 | local (VPetukhov/ks@NA) |
| 45 | labeling | 0.3 | 2014-08-23 | CRAN (R 3.4.1) |
| 46 | lattice | 0.20-35 | 2017-03-25 | CRAN (R 3.4.1) |
| 47 | lazyeval | 0.2.1 | 2017-10-29 | CRAN (R 3.4.1) |
| 48 | magrittr | 1.5 | 2014-11-22 | CRAN (R 3.4.1) |
| 49 | MASS | 7.3-47 | 2017-04-21 | CRAN (R 3.4.0) |
| 50 | Matrix | 1.2-12 | 2017-11-16 | CRAN (R 3.4.1) |
| 51 | mclust | 5.4 | 2017-11-22 | CRAN (R 3.4.1) |
| 52 | memoise | 1.1.0 | 2017-04-21 | CRAN (R 3.4.1) |
| 54 | mgcv | 1.8-22 | 2017-09-19 | CRAN (R 3.4.1) |
| 55 | munsell | 0.4.3 | 2016-02-13 | CRAN (R 3.4.1) |
| 56 | mvtnorm | 1.0-7 | 2018-01-26 | cran (@1.0-7) |
| 57 | nlme | 3.1-131 | 2017-02-06 | CRAN (R 3.4.0) |
| 58 | pagoda2 | 0.0.0.9002 | 2018-04-08 | local (hms-dbmi/pagoda2@NA) |
| 60 | pcaMethods | 1.60.0 | 2017-11-12 | Bioconductor |
| 61 | pcaPP | 1.9-73 | 2018-01-14 | cran (@1.9-73) |
| 62 | pheatmap | 1.0.8 | 2015-12-11 | CRAN (R 3.4.1) |
| 63 | pkgconfig | 2.0.1 | 2017-03-21 | CRAN (R 3.4.1) |
| 64 | plyr | 1.8.4 | 2016-06-08 | CRAN (R 3.4.1) |
| 65 | R6 | 2.2.2 | 2017-06-17 | CRAN (R 3.4.1) |
| 66 | RColorBrewer | 1.1-2 | 2014-12-07 | CRAN (R 3.4.1) |
| 67 | Rcpp | 0.12.17 | 2018-05-18 | cran (@0.12.17) |
| 68 | rjson | 0.2.19 | 2018-05-18 | cran (@0.2.19) |
| 69 | rlang | 0.1.4 | 2017-11-05 | CRAN (R 3.4.1) |
| 70 | rmarkdown | 1.9 | 2018-03-01 | CRAN (R 3.4.1) |
| 71 | Rook | 1.1-1 | 2014-10-20 | CRAN (R 3.4.1) |
| 72 | rprojroot | 1.3-2 | 2018-01-03 | cran (@1.3-2) |
| 73 | RSQLite | 2.0 | 2017-06-19 | CRAN (R 3.4.1) |
| 74 | Rtsne | 0.14 | 2017-11-12 | Github (jkrijthe/Rtsne@1d0f926) |
| 75 | S4Vectors | 0.8.11 | 2016-01-30 | Bioconductor |
| 76 | scales | 0.5.0 | 2017-08-24 | CRAN (R 3.4.1) |
| 77 | sessioninfo | 1.0.0 | 2017-06-21 | CRAN (R 3.4.1) |
| 80 | stringi | 1.1.7 | 2018-03-12 | cran (@1.1.7) |
| 81 | stringr | 1.3.0 | 2018-02-19 | cran (@1.3.0) |
| 82 | tibble | 1.3.4 | 2017-08-22 | CRAN (R 3.4.1) |
| 84 | triebeard | 0.3.0 | 2016-08-04 | cran (@0.3.0) |
| 85 | urltools | 1.7.0 | 2018-01-20 | cran (@1.7.0) |
| 87 | withr | 2.1.2 | 2018-03-15 | cran (@2.1.2) |
| 88 | yaml | 2.1.18 | 2018-03-08 | cran (@2.1.18) |
This R Markdown site was created with workflowr